
Advertisement
How Does Rashtriya Chemicals and Fertilizers Limited (NSE:RCF) Fare As A Dividend Stock?
Is Rashtriya Chemicals and Fertilizers Limited (NSE:RCF) a good dividend stock? How can we tell? Dividend paying companies with growing earnings can be highly rewarding in the long term. On the other hand, investors have been known to buy a stock because of its yield, and then lose money if the company's dividend doesn't live up to expectations.
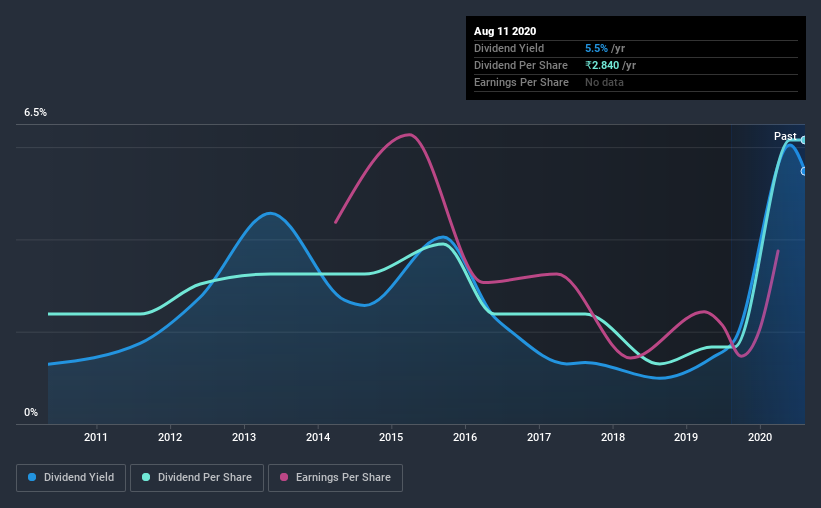
With Rashtriya Chemicals and Fertilizers yielding 5.5% and having paid a dividend for over 10 years, many investors likely find the company quite interesting. We'd guess that plenty of investors have purchased it for the income. When buying stocks for their dividends, you should always run through the checks below, to see if the dividend looks sustainable.
Explore this interactive chart for our latest analysis on Rashtriya Chemicals and Fertilizers!
Payout ratios
Dividends are typically paid from company earnings. If a company pays more in dividends than it earned, then the dividend might become unsustainable - hardly an ideal situation. As a result, we should always investigate whether a company can afford its dividend, measured as a percentage of a company's net income after tax. In the last year, Rashtriya Chemicals and Fertilizers paid out 76% of its profit as dividends. Paying out a majority of its earnings limits the amount that can be reinvested in the business. This may indicate a commitment to paying a dividend, or a dearth of investment opportunities.
We also measure dividends paid against a company's levered free cash flow, to see if enough cash was generated to cover the dividend. Unfortunately, while Rashtriya Chemicals and Fertilizers pays a dividend, it also reported negative free cash flow last year. While there may be a good reason for this, it's not ideal from a dividend perspective.
Is Rashtriya Chemicals and Fertilizers' Balance Sheet Risky?
As Rashtriya Chemicals and Fertilizers has a meaningful amount of debt, we need to check its balance sheet to see if the company might have debt risks. A rough way to check this is with these two simple ratios: a) net debt divided by EBITDA (earnings before interest, tax, depreciation and amortisation), and b) net interest cover. Net debt to EBITDA is a measure of a company's total debt. Net interest cover measures the ability to meet interest payments. Essentially we check that a) the company does not have too much debt, and b) that it can afford to pay the interest. Rashtriya Chemicals and Fertilizers has net debt of 4.24 times its EBITDA, which is getting towards the limit of most investors' comfort zones. Judicious use of debt can enhance shareholder returns, but also adds to the risk if something goes awry.
We calculated its interest cover by measuring its earnings before interest and tax (EBIT), and dividing this by the company's net interest expense. Interest cover of 2.27 times its interest expense is starting to become a concern for Rashtriya Chemicals and Fertilizers, and be aware that lenders may place additional restrictions on the company as well.
Consider getting our latest analysis on Rashtriya Chemicals and Fertilizers' financial position here.
Dividend Volatility
Before buying a stock for its income, we want to see if the dividends have been stable in the past, and if the company has a track record of maintaining its dividend. For the purpose of this article, we only scrutinise the last decade of Rashtriya Chemicals and Fertilizers' dividend payments. Its dividend payments have declined on at least one occasion over the past 10 years. During the past 10-year period, the first annual payment was ₹1.1 in 2010, compared to ₹2.8 last year. Dividends per share have grown at approximately 9.9% per year over this time. Rashtriya Chemicals and Fertilizers' dividend payments have fluctuated, so it hasn't grown 9.9% every year, but the CAGR is a useful rule of thumb for approximating the historical growth.
A reasonable rate of dividend growth is good to see, but we're wary that the dividend history is not as solid as we'd like, having been cut at least once.
Dividend Growth Potential
With a relatively unstable dividend, it's even more important to see if earnings per share (EPS) are growing. Why take the risk of a dividend getting cut, unless there's a good chance of bigger dividends in future? In the last five years, Rashtriya Chemicals and Fertilizers' earnings per share have shrunk at approximately 9.8% per annum. A modest decline in earnings per share is not great to see, but it doesn't automatically make a dividend unsustainable. Still, we'd vastly prefer to see EPS growth when researching dividend stocks.
Conclusion
To summarise, shareholders should always check that Rashtriya Chemicals and Fertilizers' dividends are affordable, that its dividend payments are relatively stable, and that it has decent prospects for growing its earnings and dividend. First, we think Rashtriya Chemicals and Fertilizers has an acceptable payout ratio, although its dividend was not well covered by cashflow. Earnings per share are down, and Rashtriya Chemicals and Fertilizers' dividend has been cut at least once in the past, which is disappointing. Using these criteria, Rashtriya Chemicals and Fertilizers looks quite suboptimal from a dividend investment perspective.
Investors generally tend to favour companies with a consistent, stable dividend policy as opposed to those operating an irregular one. At the same time, there are other factors our readers should be conscious of before pouring capital into a stock. To that end, Rashtriya Chemicals and Fertilizers has 5 warning signs (and 2 which shouldn't be ignored) we think you should know about.
We have also put together a list of global stocks with a market capitalisation above $1bn and yielding more 3%.
If you’re looking to trade Rashtriya Chemicals and Fertilizers, open an account with the lowest-cost* platform trusted by professionals, Interactive Brokers. Their clients from over 200 countries and territories trade stocks, options, futures, forex, bonds and funds worldwide from a single integrated account. Promoted
New: AI Stock Screener & Alerts
Our new AI Stock Screener scans the market every day to uncover opportunities.
• Dividend Powerhouses (3%+ Yield)
• Undervalued Small Caps with Insider Buying
• High growth Tech and AI Companies
Or build your own from over 50 metrics.
This article by Simply Wall St is general in nature. It does not constitute a recommendation to buy or sell any stock, and does not take account of your objectives, or your financial situation. We aim to bring you long-term focused analysis driven by fundamental data. Note that our analysis may not factor in the latest price-sensitive company announcements or qualitative material. Simply Wall St has no position in any stocks mentioned.
*Interactive Brokers Rated Lowest Cost Broker by StockBrokers.com Annual Online Review 2020
Have feedback on this article? Concerned about the content? Get in touch with us directly. Alternatively, email editorial-team@simplywallst.com.
About NSEI:RCF
Rashtriya Chemicals and Fertilizers
Manufactures, markets, and sells fertilizers and industrial chemicals in India.
Excellent balance sheet with proven track record.
Market Insights

Advertisement
Community Narratives
MINISO's fair value is projected at 26.69 with an anticipated PE ratio shift of 20x
Fair Value US$24.03|11.0% undervalued
BE
Community Contributor
Procter & Gamble: A Dividend Giant Facing Slowing Growth
Fair Value US$119.81|23.3% overvalued
AN
Community Contributor
Eli Lilly's Future Growth Driven by Tirzepatide and Favorable Market Conditions
Fair Value US$1.19k|13.8% undervalued
EA
Community Contributor