
Advertisement
- United States
- /
- Consumer Durables
- /
- NYSE:LEG
How Does Leggett & Platt's (NYSE:LEG) P/E Compare To Its Industry, After Its Big Share Price Gain?

Leggett & Platt (NYSE:LEG) shareholders are no doubt pleased to see that the share price has bounced 49% in the last month alone, although it is still down 29% over the last quarter. But shareholders may not all be feeling jubilant, since the share price is still down 16% in the last year.
All else being equal, a sharp share price increase should make a stock less attractive to potential investors. While the market sentiment towards a stock is very changeable, in the long run, the share price will tend to move in the same direction as earnings per share. The implication here is that deep value investors might steer clear when expectations of a company are too high. Perhaps the simplest way to get a read on investors' expectations of a business is to look at its Price to Earnings Ratio (PE Ratio). Investors have optimistic expectations of companies with higher P/E ratios, compared to companies with lower P/E ratios.
See our latest analysis for Leggett & Platt
Does Leggett & Platt Have A Relatively High Or Low P/E For Its Industry?
We can tell from its P/E ratio of 13.63 that there is some investor optimism about Leggett & Platt. You can see in the image below that the average P/E (8.2) for companies in the consumer durables industry is lower than Leggett & Platt's P/E.
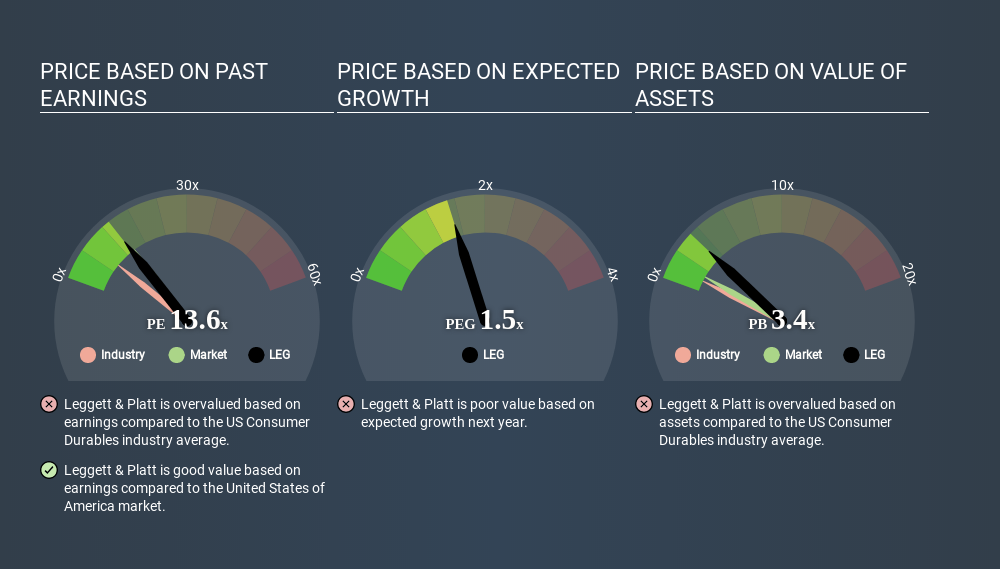
That means that the market expects Leggett & Platt will outperform other companies in its industry. Shareholders are clearly optimistic, but the future is always uncertain. So investors should delve deeper. I like to check if company insiders have been buying or selling.
How Growth Rates Impact P/E Ratios
Companies that shrink earnings per share quickly will rapidly decrease the 'E' in the equation. Therefore, even if you pay a low multiple of earnings now, that multiple will become higher in the future. So while a stock may look cheap based on past earnings, it could be expensive based on future earnings.
Leggett & Platt's earnings per share grew by 8.7% in the last twelve months. And it has bolstered its earnings per share by 9.5% per year over the last five years. In contrast, EPS has decreased by 2.3%, annually, over 3 years.
Remember: P/E Ratios Don't Consider The Balance Sheet
Don't forget that the P/E ratio considers market capitalization. In other words, it does not consider any debt or cash that the company may have on the balance sheet. In theory, a company can lower its future P/E ratio by using cash or debt to invest in growth.
Such expenditure might be good or bad, in the long term, but the point here is that the balance sheet is not reflected by this ratio.
Leggett & Platt's Balance Sheet
Leggett & Platt's net debt equates to 42% of its market capitalization. You'd want to be aware of this fact, but it doesn't bother us.
The Verdict On Leggett & Platt's P/E Ratio
Leggett & Platt's P/E is 13.6 which is about average (14.4) in the US market. Given it has some debt, and grew earnings a bit last year, the P/E indicates the market is expecting steady ongoing progress. What is very clear is that the market has become more optimistic about Leggett & Platt over the last month, with the P/E ratio rising from 9.2 back then to 13.6 today. For those who prefer to invest with the flow of momentum, that might mean it's time to put the stock on a watchlist, or research it. But the contrarian may see it as a missed opportunity.
Investors should be looking to buy stocks that the market is wrong about. If it is underestimating a company, investors can make money by buying and holding the shares until the market corrects itself. So this free visual report on analyst forecasts could hold the key to an excellent investment decision.
Of course, you might find a fantastic investment by looking at a few good candidates. So take a peek at this free list of companies with modest (or no) debt, trading on a P/E below 20.
If you spot an error that warrants correction, please contact the editor at editorial-team@simplywallst.com. This article by Simply Wall St is general in nature. It does not constitute a recommendation to buy or sell any stock, and does not take account of your objectives, or your financial situation. Simply Wall St has no position in the stocks mentioned.
We aim to bring you long-term focused research analysis driven by fundamental data. Note that our analysis may not factor in the latest price-sensitive company announcements or qualitative material. Thank you for reading.
About NYSE:LEG
Leggett & Platt
Designs, manufactures, and sells engineered components and products in the United States, Europe, China, Canada, Mexico, and internationally.
Good value with moderate growth potential.
Similar Companies
Market Insights


Advertisement
Community Narratives
The Future of Drug Testing? Fingerprint Tech Shows Serious Promise
Fair Value US$2.98|40.3% undervalued
JO
Community Contributor
Suncorp’s Next Chapter: Insurance-Only and Ready to Grow
Fair Value AU$22.83|7.9% undervalued
RO
Community Contributor
Thyssenkrupp Nucera Will Achieve Double-Digit Profits by 2030 Boosted by Hydrogen Growth
Fair Value €14.40|31.6% undervalued
CH
Community Contributor
Tesla’s Nvidia Moment – The AI & Robotics Inflection Point
Fair Value US$359.72|12.3% undervalued
BL
Community Contributor