Advertisement
- Australia
- /
- Aerospace & Defense
- /
- ASX:PTB
How Does Group's (ASX:PTB) P/E Compare To Its Industry, After Its Big Share Price Gain?
Group (ASX:PTB) shares have continued recent momentum with a 30% gain in the last month alone. But shareholders may not all be feeling jubilant, since the share price is still down 12% in the last year.
Assuming no other changes, a sharply higher share price makes a stock less attractive to potential buyers. While the market sentiment towards a stock is very changeable, in the long run, the share price will tend to move in the same direction as earnings per share. So some would prefer to hold off buying when there is a lot of optimism towards a stock. Perhaps the simplest way to get a read on investors' expectations of a business is to look at its Price to Earnings Ratio (PE Ratio). A high P/E implies that investors have high expectations of what a company can achieve compared to a company with a low P/E ratio.
Check out our latest analysis for Group
Does Group Have A Relatively High Or Low P/E For Its Industry?
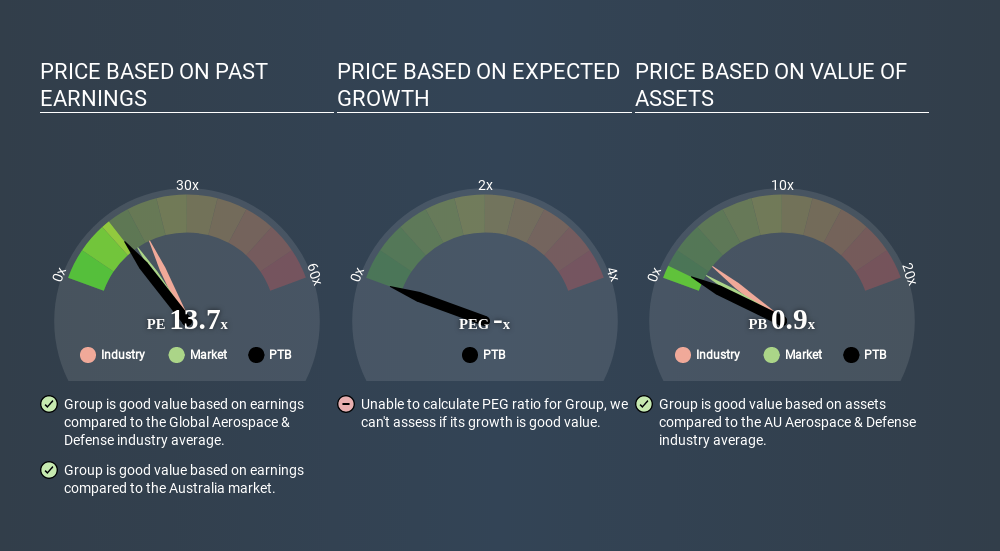
We can tell from its P/E ratio of 13.66 that sentiment around Group isn't particularly high. We can see in the image below that the average P/E (19.2) for companies in the aerospace & defense industry is higher than Group's P/E.
This suggests that market participants think Group will underperform other companies in its industry. While current expectations are low, the stock could be undervalued if the situation is better than the market assumes. You should delve deeper. I like to check if company insiders have been buying or selling.
How Growth Rates Impact P/E Ratios
Companies that shrink earnings per share quickly will rapidly decrease the 'E' in the equation. That means even if the current P/E is low, it will increase over time if the share price stays flat. Then, a higher P/E might scare off shareholders, pushing the share price down.
Group shrunk earnings per share by 31% over the last year. And EPS is down 8.4% a year, over the last 5 years. This could justify a pessimistic P/E.
Remember: P/E Ratios Don't Consider The Balance Sheet
It's important to note that the P/E ratio considers the market capitalization, not the enterprise value. Thus, the metric does not reflect cash or debt held by the company. Theoretically, a business can improve its earnings (and produce a lower P/E in the future) by investing in growth. That means taking on debt (or spending its cash).
While growth expenditure doesn't always pay off, the point is that it is a good option to have; but one that the P/E ratio ignores.
So What Does Group's Balance Sheet Tell Us?
Group has net debt worth just 9.1% of its market capitalization. The market might award it a higher P/E ratio if it had net cash, but its unlikely this low level of net borrowing is having a big impact on the P/E multiple.
The Bottom Line On Group's P/E Ratio
Group has a P/E of 13.7. That's below the average in the AU market, which is 15.5. The debt levels are not a major concern, but the lack of EPS growth is likely weighing on sentiment. What is very clear is that the market has become more optimistic about Group over the last month, with the P/E ratio rising from 10.5 back then to 13.7 today. For those who prefer to invest with the flow of momentum, that might mean it's time to put the stock on a watchlist, or research it. But the contrarian may see it as a missed opportunity.
When the market is wrong about a stock, it gives savvy investors an opportunity. If the reality for a company is not as bad as the P/E ratio indicates, then the share price should increase as the market realizes this. Although we don't have analyst forecasts you could get a better understanding of its growth by checking out this more detailed historical graph of earnings, revenue and cash flow.
Of course you might be able to find a better stock than Group. So you may wish to see this free collection of other companies that have grown earnings strongly.
Love or hate this article? Concerned about the content? Get in touch with us directly. Alternatively, email editorial-team@simplywallst.com.
This article by Simply Wall St is general in nature. It does not constitute a recommendation to buy or sell any stock, and does not take account of your objectives, or your financial situation. We aim to bring you long-term focused analysis driven by fundamental data. Note that our analysis may not factor in the latest price-sensitive company announcements or qualitative material. Simply Wall St has no position in any stocks mentioned. Thank you for reading.
About ASX:PTB
PTB Group
PTB Group Limited, together with its subsidiaries, engages in the aviation business in Australia, Papua New Guinea, New Zealand, the Pacific Islands, North and South America, Asia, Africa, and Europe.
Flawless balance sheet and good value.
Market Insights


Advertisement
Weekly Picks
ST


stuart_roberts on Upside Gold ·
An Undervalued 3.3Moz Gold Project in Canada
Fair Value:CA$5.0777.3% undervalued
2 followersusers have followed this narrative
0 commentsusers have commented on this narrative
0 likesusers have liked this narrative
JA

Jades on Coca-Cola ·
Coca-Cola’s Enduring Moat in a Health-Conscious World: Steady Compounder Poised for 5-10% Annual Returns Through Emerging Market Dominance
Fair Value:US$66.221.7% overvalued
2 followersusers have followed this narrative
0 commentsusers have commented on this narrative
0 likesusers have liked this narrative
ET

Ethan_cpa on Xero ·
Xero: Growth Was Priced In — Execution Is Not
Fair Value:AU$101.5629.3% undervalued
2 followersusers have followed this narrative
0 commentsusers have commented on this narrative
0 likesusers have liked this narrative
KA

kabz2342 on Nu Holdings ·
Nu holdings will continue to disrupt the South American banking market
Fair Value:US$64.374.8% undervalued
3 followersusers have followed this narrative
0 commentsusers have commented on this narrative
4 likesusers have liked this narrative
Recently Updated Narratives
WI


windows96 on NVIDIA ·
Steam engines 2.0: The world will find a way to meet insatiable demand for GPU’s
Fair Value:US$329.1541.8% undervalued
1 followerusers have followed this narrative
0 commentsusers have commented on this narrative
0 likesusers have liked this narrative
DA


davidlsander on Ubisoft Entertainment ·
Is Ubisoft the Market’s Biggest Pricing Error? Why Forensic Value Points to €33 Per Share
Fair Value:€33.887.7% undervalued
62 followersusers have followed this narrative
5 commentsusers have commented on this narrative
1 likeusers have liked this narrative
NA

Nat32 on NIKE ·
My long-term take on Nike: A global sports brand with steady growth potential but margin challenges to solve.
Fair Value:US$48.2730.7% overvalued
1 followerusers have followed this narrative
0 commentsusers have commented on this narrative
0 likesusers have liked this narrative
Popular Narratives
DA
davidlsander on Ubisoft Entertainment ·
Is Ubisoft the Market’s Biggest Pricing Error? Why Forensic Value Points to €33 Per Share
Fair Value:€33.887.7% undervalued
62 followersusers have followed this narrative
5 commentsusers have commented on this narrative
27 likesusers have liked this narrative
AN


AnalystConsensusTarget on Microsoft ·
Analyst Commentary Highlights Microsoft AI Momentum and Upward Valuation Amid Growth and Competitive Risks
Fair Value:US$59635.5% undervalued
1295 followersusers have followed this narrative
2 commentsusers have commented on this narrative
9 likesusers have liked this narrative
TA


Talos on Tesla ·
The "Physical AI" Monopoly – A New Industrial Revolution
Fair Value:US$665.3639.9% undervalued
49 followersusers have followed this narrative
19 commentsusers have commented on this narrative
22 likesusers have liked this narrative


