
Advertisement
- United States
- /
- Real Estate
- /
- NasdaqGS:FRPH
How Does FRP Holdings's (NASDAQ:FRPH) P/E Compare To Its Industry, After The Share Price Drop?

To the annoyance of some shareholders, FRP Holdings (NASDAQ:FRPH) shares are down a considerable 38% in the last month. Indeed the recent decline has arguably caused some bitterness for shareholders who have held through the 35% drop over twelve months.
Assuming nothing else has changed, a lower share price makes a stock more attractive to potential buyers. While the market sentiment towards a stock is very changeable, in the long run, the share price will tend to move in the same direction as earnings per share. So, on certain occasions, long term focussed investors try to take advantage of pessimistic expectations to buy shares at a better price. Perhaps the simplest way to get a read on investors' expectations of a business is to look at its Price to Earnings Ratio (PE Ratio). Investors have optimistic expectations of companies with higher P/E ratios, compared to companies with lower P/E ratios.
Check out our latest analysis for FRP Holdings
Does FRP Holdings Have A Relatively High Or Low P/E For Its Industry?
We can tell from its P/E ratio of 32.87 that there is some investor optimism about FRP Holdings. As you can see below, FRP Holdings has a higher P/E than the average company (19.1) in the real estate industry.
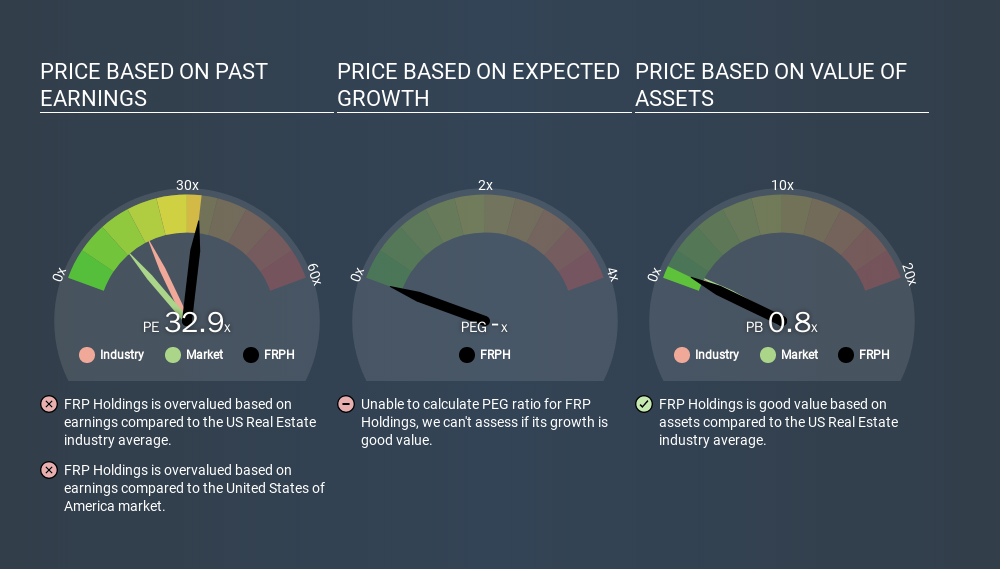
Its relatively high P/E ratio indicates that FRP Holdings shareholders think it will perform better than other companies in its industry classification. The market is optimistic about the future, but that doesn't guarantee future growth. So investors should always consider the P/E ratio alongside other factors, such as whether company directors have been buying shares.
How Growth Rates Impact P/E Ratios
Earnings growth rates have a big influence on P/E ratios. Earnings growth means that in the future the 'E' will be higher. Therefore, even if you pay a high multiple of earnings now, that multiple will become lower in the future. A lower P/E should indicate the stock is cheap relative to others -- and that may attract buyers.
FRP Holdings's earnings made like a rocket, taking off 304% last year. Having said that, if we look back three years, EPS growth has averaged a comparatively less impressive 14%.
Don't Forget: The P/E Does Not Account For Debt or Bank Deposits
It's important to note that the P/E ratio considers the market capitalization, not the enterprise value. That means it doesn't take debt or cash into account. Theoretically, a business can improve its earnings (and produce a lower P/E in the future) by investing in growth. That means taking on debt (or spending its cash).
Such spending might be good or bad, overall, but the key point here is that you need to look at debt to understand the P/E ratio in context.
FRP Holdings's Balance Sheet
FRP Holdings's net debt is 20% of its market cap. This could bring some additional risk, and reduce the number of investment options for management; worth remembering if you compare its P/E to businesses without debt.
The Bottom Line On FRP Holdings's P/E Ratio
FRP Holdings has a P/E of 32.9. That's higher than the average in its market, which is 12.7. The company is not overly constrained by its modest debt levels, and its recent EPS growth is nothing short of stand-out. So on this analysis a high P/E ratio seems reasonable. What can be absolutely certain is that the market has become significantly less optimistic about FRP Holdings over the last month, with the P/E ratio falling from 52.9 back then to 32.9 today. For those who don't like to trade against momentum, that could be a warning sign, but a contrarian investor might want to take a closer look.
Investors have an opportunity when market expectations about a stock are wrong. If the reality for a company is better than it expects, you can make money by buying and holding for the long term. We don't have analyst forecasts, but shareholders might want to examine this detailed historical graph of earnings, revenue and cash flow.
Of course you might be able to find a better stock than FRP Holdings. So you may wish to see this free collection of other companies that have grown earnings strongly.
If you spot an error that warrants correction, please contact the editor at editorial-team@simplywallst.com. This article by Simply Wall St is general in nature. It does not constitute a recommendation to buy or sell any stock, and does not take account of your objectives, or your financial situation. Simply Wall St has no position in the stocks mentioned.
We aim to bring you long-term focused research analysis driven by fundamental data. Note that our analysis may not factor in the latest price-sensitive company announcements or qualitative material. Thank you for reading.
About NasdaqGS:FRPH
Acceptable track record with mediocre balance sheet.
Similar Companies
Market Insights


Advertisement
Community Narratives
For the Emperor: Why Games Workshop Could Be a Star Investment
Fair Value UK£160.00|0.4% overvalued
RO
Community Contributor
Securitas will boost margins with AI and tech-driven services
Fair Value SEK 260.91|44.5% undervalued
UN
Community Contributor
A Leader in EV Charging with Growth Potential
Fair Value €27.00|17.8% undervalued
TI
Community Contributor