
Advertisement
- United States
- /
- Chemicals
- /
- NYSEAM:FSI
How Does Flexible Solutions International's (NYSEMKT:FSI) P/E Compare To Its Industry, After The Share Price Drop?

To the annoyance of some shareholders, Flexible Solutions International (NYSEMKT:FSI) shares are down a considerable 32% in the last month. Indeed the recent decline has arguably caused some bitterness for shareholders who have held through the 40% drop over twelve months.
All else being equal, a share price drop should make a stock more attractive to potential investors. In the long term, share prices tend to follow earnings per share, but in the short term prices bounce around in response to short term factors (which are not always obvious). The implication here is that long term investors have an opportunity when expectations of a company are too low. One way to gauge market expectations of a stock is to look at its Price to Earnings Ratio (PE Ratio). Investors have optimistic expectations of companies with higher P/E ratios, compared to companies with lower P/E ratios.
View our latest analysis for Flexible Solutions International
Does Flexible Solutions International Have A Relatively High Or Low P/E For Its Industry?
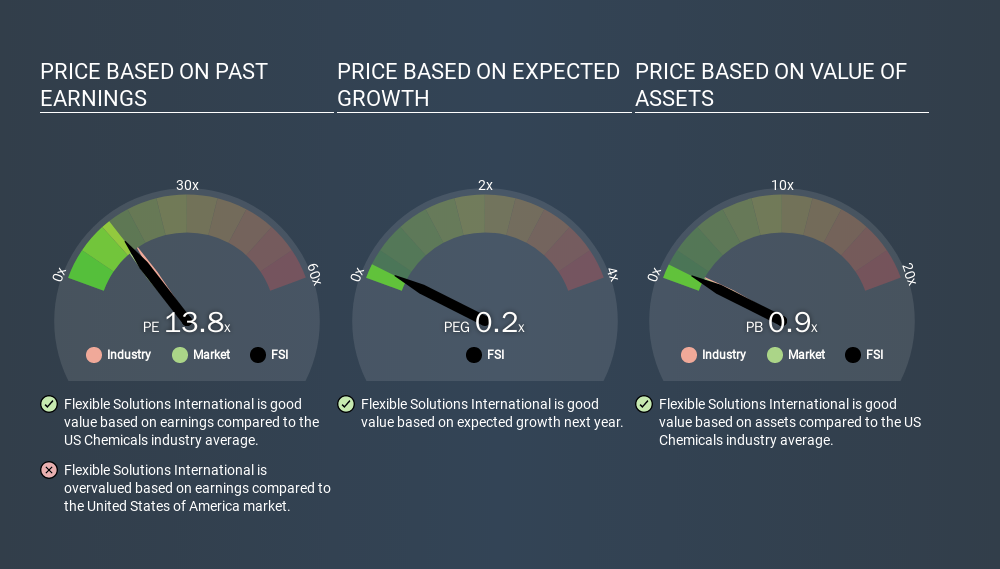
Flexible Solutions International has a P/E ratio of 13.77. You can see in the image below that the average P/E (13.7) for companies in the chemicals industry is roughly the same as Flexible Solutions International's P/E.
Flexible Solutions International's P/E tells us that market participants think its prospects are roughly in line with its industry. If the company has better than average prospects, then the market might be underestimating it. Further research into factors such as insider buying and selling, could help you form your own view on whether that is likely.
How Growth Rates Impact P/E Ratios
When earnings fall, the 'E' decreases, over time. That means even if the current P/E is low, it will increase over time if the share price stays flat. A higher P/E should indicate the stock is expensive relative to others -- and that may encourage shareholders to sell.
Flexible Solutions International saw earnings per share decrease by 2.5% last year. And EPS is down 14% a year, over the last 5 years. So it would be surprising to see a high P/E.
Remember: P/E Ratios Don't Consider The Balance Sheet
It's important to note that the P/E ratio considers the market capitalization, not the enterprise value. That means it doesn't take debt or cash into account. The exact same company would hypothetically deserve a higher P/E ratio if it had a strong balance sheet, than if it had a weak one with lots of debt, because a cashed up company can spend on growth.
Spending on growth might be good or bad a few years later, but the point is that the P/E ratio does not account for the option (or lack thereof).
Flexible Solutions International's Balance Sheet
Flexible Solutions International's net debt is 5.1% of its market cap. It would probably trade on a higher P/E ratio if it had a lot of cash, but I doubt it is having a big impact.
The Verdict On Flexible Solutions International's P/E Ratio
Flexible Solutions International's P/E is 13.8 which is above average (11.8) in its market. With some debt but no EPS growth last year, the market has high expectations of future profits. What can be absolutely certain is that the market has become significantly less optimistic about Flexible Solutions International over the last month, with the P/E ratio falling from 20.3 back then to 13.8 today. For those who prefer to invest with the flow of momentum, that might be a bad sign, but for a contrarian, it may signal opportunity.
When the market is wrong about a stock, it gives savvy investors an opportunity. If the reality for a company is better than it expects, you can make money by buying and holding for the long term. So this free visual report on analyst forecasts could hold the key to an excellent investment decision.
You might be able to find a better buy than Flexible Solutions International. If you want a selection of possible winners, check out this free list of interesting companies that trade on a P/E below 20 (but have proven they can grow earnings).
If you spot an error that warrants correction, please contact the editor at editorial-team@simplywallst.com. This article by Simply Wall St is general in nature. It does not constitute a recommendation to buy or sell any stock, and does not take account of your objectives, or your financial situation. Simply Wall St has no position in the stocks mentioned.
We aim to bring you long-term focused research analysis driven by fundamental data. Note that our analysis may not factor in the latest price-sensitive company announcements or qualitative material. Thank you for reading.
About NYSEAM:FSI
Flexible Solutions International
Develops, manufactures, and markets specialty chemicals that slow the evaporation of water in Canada, the United States, and internationally.
Flawless balance sheet with high growth potential.
Similar Companies
Market Insights


Advertisement
Community Narratives
Suncorp’s Next Chapter: Insurance-Only and Ready to Grow
Fair Value AU$22.83|5.7% undervalued
RO
Community Contributor
Thyssenkrupp Nucera Will Achieve Double-Digit Profits by 2030 Boosted by Hydrogen Growth
Fair Value €14.40|31.6% undervalued
CH
Community Contributor
Tesla’s Nvidia Moment – The AI & Robotics Inflection Point
Fair Value US$384.84|18.0% undervalued
BL
Community Contributor