Advertisement
- Canada
- /
- Healthcare Services
- /
- TSX:EXE
How Does Extendicare's (TSE:EXE) P/E Compare To Its Industry, After The Share Price Drop?
To the annoyance of some shareholders, Extendicare (TSE:EXE) shares are down a considerable 31% in the last month. The recent drop has obliterated the annual return, with the share price now down 17% over that longer period.
Assuming nothing else has changed, a lower share price makes a stock more attractive to potential buyers. While the market sentiment towards a stock is very changeable, in the long run, the share price will tend to move in the same direction as earnings per share. So, on certain occasions, long term focussed investors try to take advantage of pessimistic expectations to buy shares at a better price. Perhaps the simplest way to get a read on investors' expectations of a business is to look at its Price to Earnings Ratio (PE Ratio). A high P/E implies that investors have high expectations of what a company can achieve compared to a company with a low P/E ratio.
See our latest analysis for Extendicare
Does Extendicare Have A Relatively High Or Low P/E For Its Industry?
We can tell from its P/E ratio of 31.16 that there is some investor optimism about Extendicare. You can see in the image below that the average P/E (28.8) for companies in the healthcare industry is lower than Extendicare's P/E.
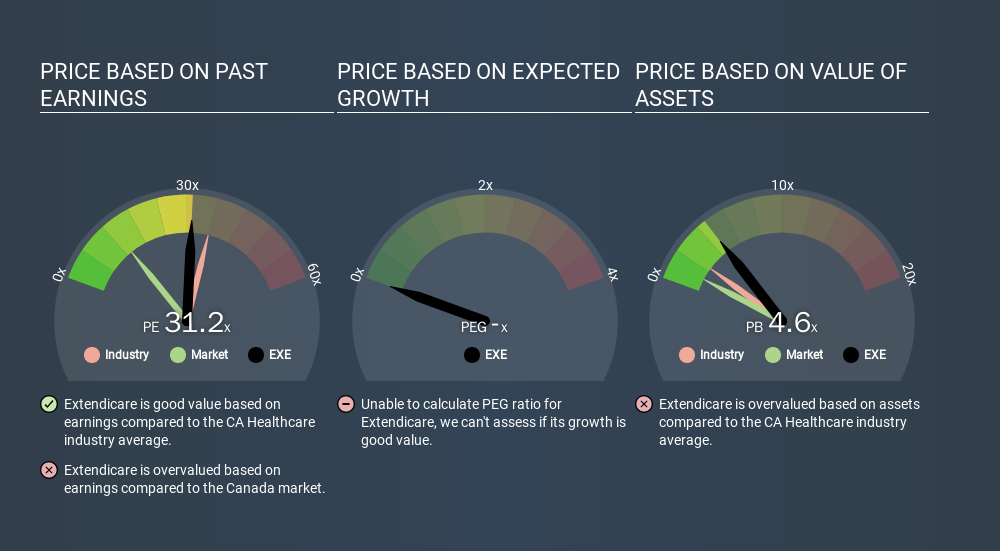
That means that the market expects Extendicare will outperform other companies in its industry. The market is optimistic about the future, but that doesn't guarantee future growth. So further research is always essential. I often monitor director buying and selling.
How Growth Rates Impact P/E Ratios
Companies that shrink earnings per share quickly will rapidly decrease the 'E' in the equation. That means unless the share price falls, the P/E will increase in a few years. So while a stock may look cheap based on past earnings, it could be expensive based on future earnings.
Extendicare's earnings made like a rocket, taking off 109% last year. Unfortunately, earnings per share are down 19% a year, over 3 years.
Remember: P/E Ratios Don't Consider The Balance Sheet
Don't forget that the P/E ratio considers market capitalization. So it won't reflect the advantage of cash, or disadvantage of debt. Theoretically, a business can improve its earnings (and produce a lower P/E in the future) by investing in growth. That means taking on debt (or spending its cash).
Spending on growth might be good or bad a few years later, but the point is that the P/E ratio does not account for the option (or lack thereof).
So What Does Extendicare's Balance Sheet Tell Us?
Extendicare's net debt is 71% of its market cap. This is a reasonably significant level of debt -- all else being equal you'd expect a much lower P/E than if it had net cash.
The Verdict On Extendicare's P/E Ratio
Extendicare trades on a P/E ratio of 31.2, which is above its market average of 11.6. While its debt levels are rather high, at least its EPS is growing quickly. So despite the debt it is, perhaps, not unreasonable to see a high P/E ratio. Given Extendicare's P/E ratio has declined from 45.3 to 31.2 in the last month, we know for sure that the market is significantly less confident about the business today, than it was back then. For those who don't like to trade against momentum, that could be a warning sign, but a contrarian investor might want to take a closer look.
Investors have an opportunity when market expectations about a stock are wrong. People often underestimate remarkable growth -- so investors can make money when fast growth is not fully appreciated. So this free report on the analyst consensus forecasts could help you make a master move on this stock.
But note: Extendicare may not be the best stock to buy. So take a peek at this free list of interesting companies with strong recent earnings growth (and a P/E ratio below 20).
If you spot an error that warrants correction, please contact the editor at editorial-team@simplywallst.com. This article by Simply Wall St is general in nature. It does not constitute a recommendation to buy or sell any stock, and does not take account of your objectives, or your financial situation. Simply Wall St has no position in the stocks mentioned.
We aim to bring you long-term focused research analysis driven by fundamental data. Note that our analysis may not factor in the latest price-sensitive company announcements or qualitative material. Thank you for reading.
About TSX:EXE
Extendicare
Through its subsidiaries, provides care and services for seniors in Canada.
Outstanding track record with flawless balance sheet and pays a dividend.
Market Insights


Advertisement
Weekly Picks
LO


Lou_Basenese on Virtuix Holdings ·
From a “Shark Tank” Snub to an Air Force “Yes”: Why Virtuix at $3.50 May Be the Market’s Most Mispriced AI Story
Fair Value:US$7.562.8% undervalued
19 followersusers have followed this narrative
0 commentsusers have commented on this narrative
2 likesusers have liked this narrative
IN


Investingwilly on Mastercard ·
Mastercard: The Best Dividend Stock You're Ignoring
Fair Value:US$75033.5% undervalued
66 followersusers have followed this narrative
1 commentusers have commented on this narrative
8 likesusers have liked this narrative
TR


tripledub on Intuit ·
A Wonderful Business at a Not-So-Wonderful Price
Fair Value:US$56052.2% undervalued
63 followersusers have followed this narrative
4 commentsusers have commented on this narrative
29 likesusers have liked this narrative
TA


Talos on MindWalk Holdings ·
The Asymmetric TechBio Play: MindWalk Holdings and the Valuation Disconnect
Fair Value:US$8.2780.9% undervalued
35 followersusers have followed this narrative
0 commentsusers have commented on this narrative
9 likesusers have liked this narrative
Recently Updated Narratives
RO


RockeTeller on NeXGold Mining ·
NexGold Mining: 4.7Moz M&I Resources, $100M Cash + Debt-Free, Construction Decision 2026 Undervalued Canadian Gold Developer
Fair Value:CA$39.5296.9% undervalued
4 followersusers have followed this narrative
3 commentsusers have commented on this narrative
0 likesusers have liked this narrative
FA


Faltaren on AmpliTech Group ·
AmpliTech Group Will Triple Revenue by 2030 with O-RAN Expansion
Fair Value:US$3078.2% undervalued
1 followerusers have followed this narrative
0 commentsusers have commented on this narrative
0 likesusers have liked this narrative
AS


AstrisCorporateAdvisory on Polaris Holdings ·
Share gains to fuel earnings momentum
Fair Value:JP¥211.166.7% undervalued
2 followersusers have followed this narrative
0 commentsusers have commented on this narrative
0 likesusers have liked this narrative
Popular Narratives
HA


HarishPK on Adobe ·
Adobe: A Probabilistic Case for Undervaluation
Fair Value:US$319.9636.6% undervalued
61 followersusers have followed this narrative
9 commentsusers have commented on this narrative
19 likesusers have liked this narrative
MA


martinarauz on Nu Holdings ·
Investment Analysis (May 2026)
Fair Value:US$22.7442.1% undervalued
68 followersusers have followed this narrative
0 commentsusers have commented on this narrative
17 likesusers have liked this narrative
IN
Investingwilly on Mastercard ·
Mastercard: The Best Dividend Stock You're Ignoring
Fair Value:US$75033.5% undervalued
66 followersusers have followed this narrative
1 commentusers have commented on this narrative
8 likesusers have liked this narrative
