- India
- /
- Commercial Services
- /
- NSEI:PTL
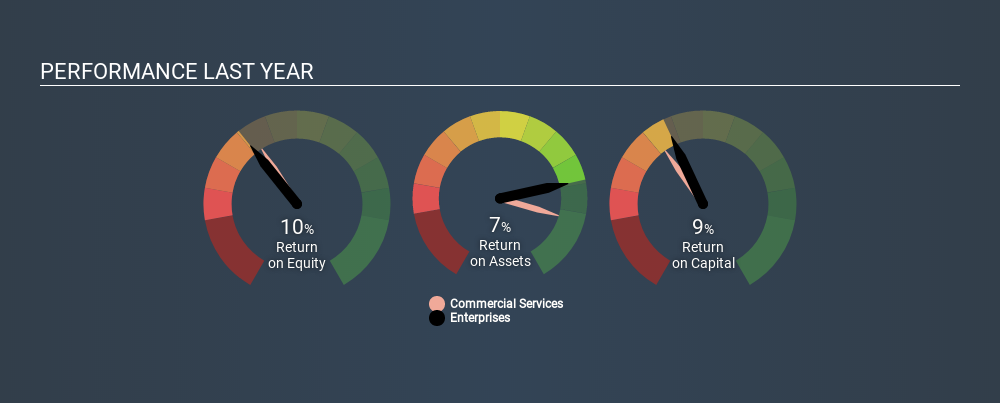
How Do PTL Enterprises Limited’s (NSE:PTL) Returns Compare To Its Industry?


Today we'll look at PTL Enterprises Limited (NSE:PTL) and reflect on its potential as an investment. Specifically, we're going to calculate its Return On Capital Employed (ROCE), in the hopes of getting some insight into the business.
First, we'll go over how we calculate ROCE. Then we'll compare its ROCE to similar companies. And finally, we'll look at how its current liabilities are impacting its ROCE.
What is Return On Capital Employed (ROCE)?
ROCE is a metric for evaluating how much pre-tax income (in percentage terms) a company earns on the capital invested in its business. In general, businesses with a higher ROCE are usually better quality. Ultimately, it is a useful but imperfect metric. Renowned investment researcher Michael Mauboussin has suggested that a high ROCE can indicate that 'one dollar invested in the company generates value of more than one dollar'.
So, How Do We Calculate ROCE?
Analysts use this formula to calculate return on capital employed:
Return on Capital Employed = Earnings Before Interest and Tax (EBIT) ÷ (Total Assets - Current Liabilities)
Or for Enterprises:
0.09 = ₹566m ÷ (₹6.5b - ₹193m) (Based on the trailing twelve months to March 2020.)
Therefore, Enterprises has an ROCE of 9.0%.
See our latest analysis for Enterprises
Is Enterprises's ROCE Good?
ROCE can be useful when making comparisons, such as between similar companies. In this analysis, Enterprises's ROCE appears meaningfully below the 14% average reported by the Commercial Services industry. This performance is not ideal, as it suggests the company may not be deploying its capital as effectively as some competitors. Putting aside Enterprises's performance relative to its industry, its ROCE in absolute terms is poor - considering the risk of owning stocks compared to government bonds. It is likely that there are more attractive prospects out there.
You can see in the image below how Enterprises's ROCE compares to its industry. Click to see more on past growth.
When considering this metric, keep in mind that it is backwards looking, and not necessarily predictive. Companies in cyclical industries can be difficult to understand using ROCE, as returns typically look high during boom times, and low during busts. ROCE is only a point-in-time measure. How cyclical is Enterprises? You can see for yourself by looking at this free graph of past earnings, revenue and cash flow.
Do Enterprises's Current Liabilities Skew Its ROCE?
Current liabilities are short term bills and invoices that need to be paid in 12 months or less. The ROCE equation subtracts current liabilities from capital employed, so a company with a lot of current liabilities appears to have less capital employed, and a higher ROCE than otherwise. To counteract this, we check if a company has high current liabilities, relative to its total assets.
Enterprises has current liabilities of ₹193m and total assets of ₹6.5b. As a result, its current liabilities are equal to approximately 3.0% of its total assets. Enterprises has very few current liabilities, which have a minimal effect on its already low ROCE.
Our Take On Enterprises's ROCE
Still, investors could probably find more attractive prospects with better performance out there. You might be able to find a better investment than Enterprises. If you want a selection of possible winners, check out this free list of interesting companies that trade on a P/E below 20 (but have proven they can grow earnings).
If you like to buy stocks alongside management, then you might just love this free list of companies. (Hint: insiders have been buying them).
Love or hate this article? Concerned about the content? Get in touch with us directly. Alternatively, email editorial-team@simplywallst.com.
This article by Simply Wall St is general in nature. It does not constitute a recommendation to buy or sell any stock, and does not take account of your objectives, or your financial situation. We aim to bring you long-term focused analysis driven by fundamental data. Note that our analysis may not factor in the latest price-sensitive company announcements or qualitative material. Simply Wall St has no position in any stocks mentioned. Thank you for reading.
About NSEI:PTL
PTL Enterprises
PTL Enterprises Limited leases of plant to Apollo Tyres Limited.
Established dividend payer with proven track record.
Market Insights

Community Narratives

