Advertisement
- United States
- /
- Trade Distributors
- /
- NYSE:GWW
Here's What W.W. Grainger, Inc.'s (NYSE:GWW) P/E Is Telling Us
This article is for investors who would like to improve their understanding of price to earnings ratios (P/E ratios). We'll show how you can use W.W. Grainger, Inc.'s (NYSE:GWW) P/E ratio to inform your assessment of the investment opportunity. What is W.W. Grainger's P/E ratio? Well, based on the last twelve months it is 17.92. That means that at current prices, buyers pay $17.92 for every $1 in trailing yearly profits.
See our latest analysis for W.W. Grainger
How Do You Calculate W.W. Grainger's P/E Ratio?
The formula for P/E is:
Price to Earnings Ratio = Share Price ÷ Earnings per Share (EPS)
Or for W.W. Grainger:
P/E of 17.92 = $263.38 ÷ $14.7 (Based on the trailing twelve months to June 2019.)
Is A High Price-to-Earnings Ratio Good?
A higher P/E ratio means that buyers have to pay a higher price for each $1 the company has earned over the last year. That is not a good or a bad thing per se, but a high P/E does imply buyers are optimistic about the future.
How Does W.W. Grainger's P/E Ratio Compare To Its Peers?
One good way to get a quick read on what market participants expect of a company is to look at its P/E ratio. You can see in the image below that the average P/E (14.6) for companies in the trade distributors industry is lower than W.W. Grainger's P/E.
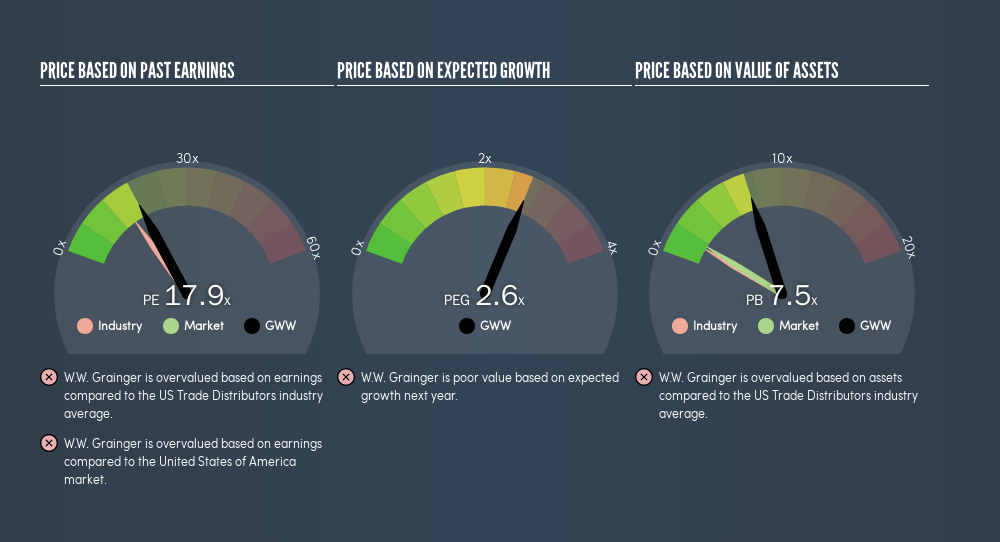
W.W. Grainger's P/E tells us that market participants think the company will perform better than its industry peers, going forward.
How Growth Rates Impact P/E Ratios
P/E ratios primarily reflect market expectations around earnings growth rates. That's because companies that grow earnings per share quickly will rapidly increase the 'E' in the equation. That means even if the current P/E is high, it will reduce over time if the share price stays flat. And as that P/E ratio drops, the company will look cheap, unless its share price increases.
W.W. Grainger's earnings per share grew by -6.6% in the last twelve months. And its annual EPS growth rate over 5 years is 5.4%.
Don't Forget: The P/E Does Not Account For Debt or Bank Deposits
Don't forget that the P/E ratio considers market capitalization. Thus, the metric does not reflect cash or debt held by the company. The exact same company would hypothetically deserve a higher P/E ratio if it had a strong balance sheet, than if it had a weak one with lots of debt, because a cashed up company can spend on growth.
Spending on growth might be good or bad a few years later, but the point is that the P/E ratio does not account for the option (or lack thereof).
W.W. Grainger's Balance Sheet
W.W. Grainger's net debt is 13% of its market cap. That's enough debt to impact the P/E ratio a little; so keep it in mind if you're comparing it to companies without debt.
The Verdict On W.W. Grainger's P/E Ratio
W.W. Grainger's P/E is 17.9 which is about average (17.3) in the US market. When you consider the modest EPS growth last year (along with some debt), it seems the market thinks the growth is sustainable.
When the market is wrong about a stock, it gives savvy investors an opportunity. As value investor Benjamin Graham famously said, 'In the short run, the market is a voting machine but in the long run, it is a weighing machine.' So this free report on the analyst consensus forecasts could help you make a master move on this stock.
Of course, you might find a fantastic investment by looking at a few good candidates. So take a peek at this free list of companies with modest (or no) debt, trading on a P/E below 20.
We aim to bring you long-term focused research analysis driven by fundamental data. Note that our analysis may not factor in the latest price-sensitive company announcements or qualitative material.
If you spot an error that warrants correction, please contact the editor at editorial-team@simplywallst.com. This article by Simply Wall St is general in nature. It does not constitute a recommendation to buy or sell any stock, and does not take account of your objectives, or your financial situation. Simply Wall St has no position in the stocks mentioned. Thank you for reading.
About NYSE:GWW
W.W. Grainger
Distributes maintenance, repair, and operating products and services primarily in North America, Japan, and the United Kingdom.
Flawless balance sheet average dividend payer.
Similar Companies
Market Insights


Advertisement
Weekly Picks
CE


Ceazar on Conexeu Sciences ·
This small biotech is developing technology that could potentially change how tissue is rebuilt
Fair Value:US$25.3458.4% undervalued
53 followersusers have followed this narrative
0 commentsusers have commented on this narrative
6 likesusers have liked this narrative
IN


Investingwilly on Mastercard ·
Mastercard: The Best Dividend Stock You're Ignoring
Fair Value:US$75034.9% undervalued
6 followersusers have followed this narrative
0 commentsusers have commented on this narrative
3 likesusers have liked this narrative
TR


tripledub on Intuit ·
A Wonderful Business at a Not-So-Wonderful Price
Fair Value:US$56053.9% undervalued
44 followersusers have followed this narrative
1 commentusers have commented on this narrative
26 likesusers have liked this narrative
TA


Talos on MindWalk Holdings ·
The Asymmetric TechBio Play: MindWalk Holdings and the Valuation Disconnect
Fair Value:US$8.2782.0% undervalued
9 followersusers have followed this narrative
0 commentsusers have commented on this narrative
4 likesusers have liked this narrative
Recently Updated Narratives
HA


HarishPK on Amdocs ·
Why Amdocs is a high conviction Buy for me?
Fair Value:US$82.0336.2% undervalued
2 followersusers have followed this narrative
1 commentusers have commented on this narrative
0 likesusers have liked this narrative
DE


Delphic on NuScale Power ·
NuScale is Postioned For Long-Term Growth
Fair Value:US$10089.1% undervalued
10 followersusers have followed this narrative
0 commentsusers have commented on this narrative
0 likesusers have liked this narrative
TR

Treasury_Raccoon_w0gg on Walmart ·
Walmart's 'Other' Segment Will Power New Growth Beyond Retail
Fair Value:US$154.5822.7% undervalued
1 followerusers have followed this narrative
0 commentsusers have commented on this narrative
0 likesusers have liked this narrative
Popular Narratives
MA


martinarauz on Nu Holdings ·
Investment Analysis (May 2026)
Fair Value:US$22.7444.6% undervalued
67 followersusers have followed this narrative
0 commentsusers have commented on this narrative
16 likesusers have liked this narrative
HA

HarishPK on Adobe ·
Adobe: A Probabilistic Case for Undervaluation
Fair Value:US$319.9638.3% undervalued
61 followersusers have followed this narrative
9 commentsusers have commented on this narrative
18 likesusers have liked this narrative
HE


HedgeY on AST SpaceMobile ·
AST SpaceMobile: The Boldest Direct-to-Cell Bet in Public Markets
Fair Value:US$17057.1% undervalued
51 followersusers have followed this narrative
0 commentsusers have commented on this narrative
13 likesusers have liked this narrative
