
Advertisement
- New Zealand
- /
- Telecom Services and Carriers
- /
- NZSE:SPK
Here's What Spark New Zealand Limited's (NZSE:SPK) ROCE Can Tell Us

Today we'll look at Spark New Zealand Limited (NZSE:SPK) and reflect on its potential as an investment. To be precise, we'll consider its Return On Capital Employed (ROCE), as that will inform our view of the quality of the business.
Firstly, we'll go over how we calculate ROCE. Second, we'll look at its ROCE compared to similar companies. And finally, we'll look at how its current liabilities are impacting its ROCE.
Return On Capital Employed (ROCE): What is it?
ROCE is a metric for evaluating how much pre-tax income (in percentage terms) a company earns on the capital invested in its business. Generally speaking a higher ROCE is better. Overall, it is a valuable metric that has its flaws. Author Edwin Whiting says to be careful when comparing the ROCE of different businesses, since 'No two businesses are exactly alike.
So, How Do We Calculate ROCE?
Analysts use this formula to calculate return on capital employed:
Return on Capital Employed = Earnings Before Interest and Tax (EBIT) ÷ (Total Assets - Current Liabilities)
Or for Spark New Zealand:
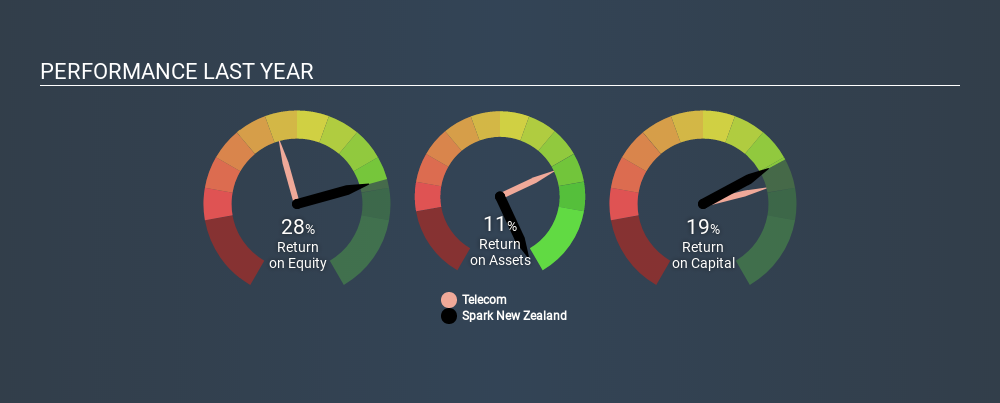
0.19 = NZ$611m ÷ (NZ$4.1b - NZ$944m) (Based on the trailing twelve months to June 2019.)
So, Spark New Zealand has an ROCE of 19%.
See our latest analysis for Spark New Zealand
Is Spark New Zealand's ROCE Good?
ROCE can be useful when making comparisons, such as between similar companies. In our analysis, Spark New Zealand's ROCE is meaningfully higher than the 10% average in the Telecom industry. I think that's good to see, since it implies the company is better than other companies at making the most of its capital. Putting aside its position relative to its industry for now, in absolute terms, Spark New Zealand's ROCE is currently very good.
You can click on the image below to see (in greater detail) how Spark New Zealand's past growth compares to other companies.
When considering ROCE, bear in mind that it reflects the past and does not necessarily predict the future. Companies in cyclical industries can be difficult to understand using ROCE, as returns typically look high during boom times, and low during busts. This is because ROCE only looks at one year, instead of considering returns across a whole cycle. What happens in the future is pretty important for investors, so we have prepared a free report on analyst forecasts for Spark New Zealand.
Do Spark New Zealand's Current Liabilities Skew Its ROCE?
Current liabilities are short term bills and invoices that need to be paid in 12 months or less. The ROCE equation subtracts current liabilities from capital employed, so a company with a lot of current liabilities appears to have less capital employed, and a higher ROCE than otherwise. To counteract this, we check if a company has high current liabilities, relative to its total assets.
Spark New Zealand has total assets of NZ$4.1b and current liabilities of NZ$944m. As a result, its current liabilities are equal to approximately 23% of its total assets. A minimal amount of current liabilities limits the impact on ROCE.
Our Take On Spark New Zealand's ROCE
This is good to see, and with such a high ROCE, Spark New Zealand may be worth a closer look. Spark New Zealand shapes up well under this analysis, but it is far from the only business delivering excellent numbers . You might also want to check this free collection of companies delivering excellent earnings growth.
For those who like to find winning investments this free list of growing companies with recent insider purchasing, could be just the ticket.
If you spot an error that warrants correction, please contact the editor at editorial-team@simplywallst.com. This article by Simply Wall St is general in nature. It does not constitute a recommendation to buy or sell any stock, and does not take account of your objectives, or your financial situation. Simply Wall St has no position in the stocks mentioned.
We aim to bring you long-term focused research analysis driven by fundamental data. Note that our analysis may not factor in the latest price-sensitive company announcements or qualitative material. Thank you for reading.
About NZSE:SPK
Spark New Zealand
Provides telecommunications and digital services in New Zealand.
Average dividend payer with mediocre balance sheet.
Similar Companies
Market Insights


Advertisement
Community Narratives
For the Emperor: Why Games Workshop Could Be a Star Investment
Fair Value UK£160.00|0.4% undervalued
RO
Community Contributor
Securitas will boost margins with AI and tech-driven services
Fair Value SEK 260.91|45.0% undervalued
UN
Community Contributor
A Leader in EV Charging with Growth Potential
Fair Value €27.00|20.4% undervalued
TI
Community Contributor