
Advertisement
- United States
- /
- Medical Equipment
- /
- NYSE:GMED
Here's What Globus Medical, Inc.'s (NYSE:GMED) ROCE Can Tell Us

Today we are going to look at Globus Medical, Inc. (NYSE:GMED) to see whether it might be an attractive investment prospect. Specifically, we'll consider its Return On Capital Employed (ROCE), since that will give us an insight into how efficiently the business can generate profits from the capital it requires.
First, we'll go over how we calculate ROCE. Second, we'll look at its ROCE compared to similar companies. Finally, we'll look at how its current liabilities affect its ROCE.
Return On Capital Employed (ROCE): What is it?
ROCE is a metric for evaluating how much pre-tax income (in percentage terms) a company earns on the capital invested in its business. All else being equal, a better business will have a higher ROCE. Overall, it is a valuable metric that has its flaws. Author Edwin Whiting says to be careful when comparing the ROCE of different businesses, since 'No two businesses are exactly alike.
How Do You Calculate Return On Capital Employed?
The formula for calculating the return on capital employed is:
Return on Capital Employed = Earnings Before Interest and Tax (EBIT) ÷ (Total Assets - Current Liabilities)
Or for Globus Medical:
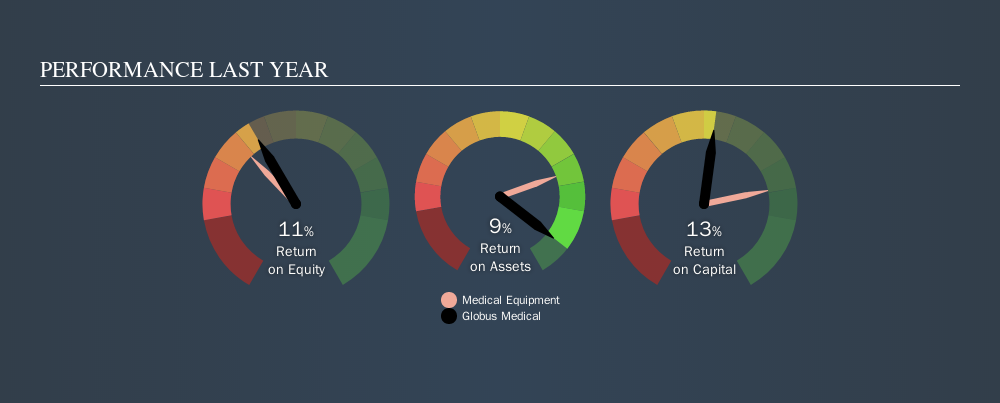
0.13 = US$169m ÷ (US$1.4b - US$84m) (Based on the trailing twelve months to June 2019.)
Therefore, Globus Medical has an ROCE of 13%.
Check out our latest analysis for Globus Medical
Does Globus Medical Have A Good ROCE?
One way to assess ROCE is to compare similar companies. In our analysis, Globus Medical's ROCE is meaningfully higher than the 10.0% average in the Medical Equipment industry. We consider this a positive sign, because it suggests it uses capital more efficiently than similar companies. Regardless of where Globus Medical sits next to its industry, its ROCE in absolute terms appears satisfactory, and this company could be worth a closer look.
We can see that, Globus Medical currently has an ROCE of 13%, less than the 21% it reported 3 years ago. Therefore we wonder if the company is facing new headwinds. The image below shows how Globus Medical's ROCE compares to its industry.
Remember that this metric is backwards looking - it shows what has happened in the past, and does not accurately predict the future. ROCE can be deceptive for cyclical businesses, as returns can look incredible in boom times, and terribly low in downturns. This is because ROCE only looks at one year, instead of considering returns across a whole cycle. Since the future is so important for investors, you should check out our free report on analyst forecasts for Globus Medical.
How Globus Medical's Current Liabilities Impact Its ROCE
Short term (or current) liabilities, are things like supplier invoices, overdrafts, or tax bills that need to be paid within 12 months. Due to the way ROCE is calculated, a high level of current liabilities makes a company look as though it has less capital employed, and thus can (sometimes unfairly) boost the ROCE. To counteract this, we check if a company has high current liabilities, relative to its total assets.
Globus Medical has total assets of US$1.4b and current liabilities of US$84m. As a result, its current liabilities are equal to approximately 6.1% of its total assets. With low current liabilities, Globus Medical's decent ROCE looks that much more respectable.
The Bottom Line On Globus Medical's ROCE
This is good to see, and while better prospects may exist, Globus Medical seems worth researching further. Globus Medical shapes up well under this analysis, but it is far from the only business delivering excellent numbers . You might also want to check this free collection of companies delivering excellent earnings growth.
I will like Globus Medical better if I see some big insider buys. While we wait, check out this free list of growing companies with considerable, recent, insider buying.
We aim to bring you long-term focused research analysis driven by fundamental data. Note that our analysis may not factor in the latest price-sensitive company announcements or qualitative material.
If you spot an error that warrants correction, please contact the editor at editorial-team@simplywallst.com. This article by Simply Wall St is general in nature. It does not constitute a recommendation to buy or sell any stock, and does not take account of your objectives, or your financial situation. Simply Wall St has no position in the stocks mentioned. Thank you for reading.
About NYSE:GMED
Globus Medical
A medical device company, develops and commercializes healthcare solutions for patients with musculoskeletal disorders in the United States and internationally.
Flawless balance sheet and good value.
Similar Companies
Market Insights


Advertisement
Community Narratives
The Future of Drug Testing? Fingerprint Tech Shows Serious Promise
Fair Value US$2.98|40.3% undervalued
JO
Community Contributor
Suncorp’s Next Chapter: Insurance-Only and Ready to Grow
Fair Value AU$22.83|7.6% undervalued
RO
Community Contributor
Thyssenkrupp Nucera Will Achieve Double-Digit Profits by 2030 Boosted by Hydrogen Growth
Fair Value €14.40|30.6% undervalued
CH
Community Contributor
Tesla’s Nvidia Moment – The AI & Robotics Inflection Point
Fair Value US$359.72|12.3% undervalued
BL
Community Contributor