Advertisement
- United States
- /
- Consumer Durables
- /
- NasdaqGS:CVCO
Here's What Cavco Industries, Inc.'s (NASDAQ:CVCO) P/E Is Telling Us
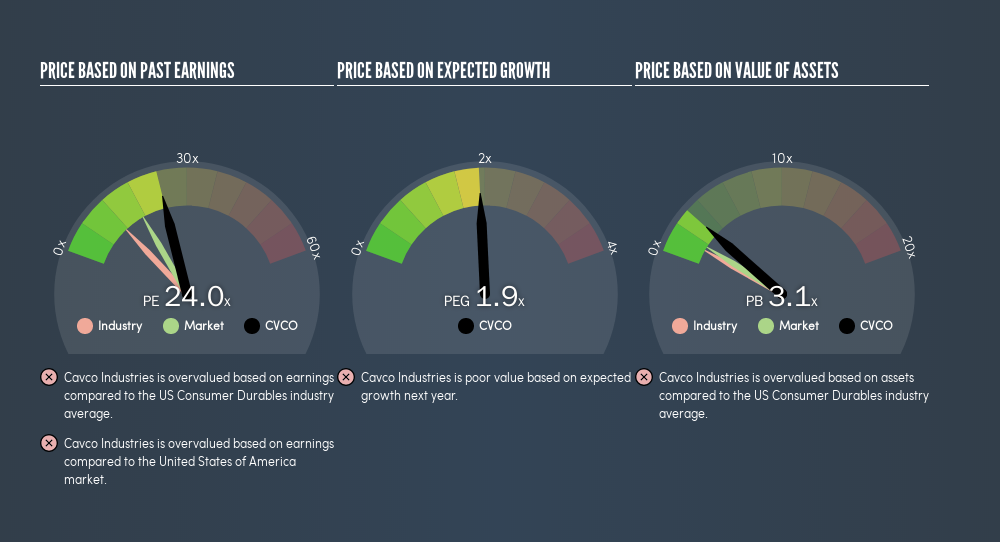
This article is written for those who want to get better at using price to earnings ratios (P/E ratios). We'll look at Cavco Industries, Inc.'s (NASDAQ:CVCO) P/E ratio and reflect on what it tells us about the company's share price. Cavco Industries has a P/E ratio of 24, based on the last twelve months. In other words, at today's prices, investors are paying $24 for every $1 in prior year profit.
Check out our latest analysis for Cavco Industries
How Do I Calculate A Price To Earnings Ratio?
The formula for P/E is:
Price to Earnings Ratio = Share Price ÷ Earnings per Share (EPS)
Or for Cavco Industries:
P/E of 24 = $185.31 ÷ $7.72 (Based on the year to June 2019.)
Is A High Price-to-Earnings Ratio Good?
A higher P/E ratio means that buyers have to pay a higher price for each $1 the company has earned over the last year. That isn't necessarily good or bad, but a high P/E implies relatively high expectations of what a company can achieve in the future.
How Does Cavco Industries's P/E Ratio Compare To Its Peers?
We can get an indication of market expectations by looking at the P/E ratio. As you can see below, Cavco Industries has a higher P/E than the average company (11.4) in the consumer durables industry.
That means that the market expects Cavco Industries will outperform other companies in its industry.
How Growth Rates Impact P/E Ratios
Probably the most important factor in determining what P/E a company trades on is the earnings growth. When earnings grow, the 'E' increases, over time. That means unless the share price increases, the P/E will reduce in a few years. A lower P/E should indicate the stock is cheap relative to others -- and that may attract buyers.
Cavco Industries's earnings per share were pretty steady over the last year. But it has grown its earnings per share by 27% per year over the last five years.
Don't Forget: The P/E Does Not Account For Debt or Bank Deposits
It's important to note that the P/E ratio considers the market capitalization, not the enterprise value. In other words, it does not consider any debt or cash that the company may have on the balance sheet. Theoretically, a business can improve its earnings (and produce a lower P/E in the future) by investing in growth. That means taking on debt (or spending its cash).
Such expenditure might be good or bad, in the long term, but the point here is that the balance sheet is not reflected by this ratio.
So What Does Cavco Industries's Balance Sheet Tell Us?
Cavco Industries has net cash of US$180m. This is fairly high at 11% of its market capitalization. That might mean balance sheet strength is important to the business, but should also help push the P/E a bit higher than it would otherwise be.
The Bottom Line On Cavco Industries's P/E Ratio
Cavco Industries has a P/E of 24. That's higher than the average in its market, which is 17.2. EPS was up modestly better over the last twelve months. And the healthy balance sheet means the company can sustain growth while the P/E suggests shareholders think it will.
Investors should be looking to buy stocks that the market is wrong about. If the reality for a company is better than it expects, you can make money by buying and holding for the long term. So this free visual report on analyst forecasts could hold the key to an excellent investment decision.
Of course, you might find a fantastic investment by looking at a few good candidates. So take a peek at this free list of companies with modest (or no) debt, trading on a P/E below 20.
We aim to bring you long-term focused research analysis driven by fundamental data. Note that our analysis may not factor in the latest price-sensitive company announcements or qualitative material.
If you spot an error that warrants correction, please contact the editor at editorial-team@simplywallst.com. This article by Simply Wall St is general in nature. It does not constitute a recommendation to buy or sell any stock, and does not take account of your objectives, or your financial situation. Simply Wall St has no position in the stocks mentioned. Thank you for reading.
About NasdaqGS:CVCO
Cavco Industries
Designs, produces, and retails factory-built homes primarily in the United States.
Flawless balance sheet with solid track record.
Similar Companies
Market Insights


Advertisement
Weekly Picks
CE


Ceazar on Conexeu Sciences ·
This small biotech is developing technology that could potentially change how tissue is rebuilt
Fair Value:US$25.3451.9% undervalued
49 followersusers have followed this narrative
0 commentsusers have commented on this narrative
5 likesusers have liked this narrative
HE


HedgeY on Quanta Services ·
The Picks-and-Shovels Leader of the Grid Supercycle
Fair Value:US$7104.2% overvalued
52 followersusers have followed this narrative
0 commentsusers have commented on this narrative
5 likesusers have liked this narrative
FU

FundamentalFlow on Karman Holdings ·
KRMN — Karman Space & Defense: Down 58% from Peak, Is the Market Mispricing a Hypergrowth Defense Compounder?
Fair Value:US$105.654.8% undervalued
34 followersusers have followed this narrative
2 commentsusers have commented on this narrative
16 likesusers have liked this narrative
DO


Double_Bubbler on Invinity Energy Systems ·
Invinity Energy Systems: All About That BESS
Fair Value:UK£161.9% undervalued
40 followersusers have followed this narrative
0 commentsusers have commented on this narrative
6 likesusers have liked this narrative
Recently Updated Narratives
MO

Momentum_Panda_y9xg on Netflix ·
Netflix's Revenue Surge Will Hit 18% Despite Market Lows
Fair Value:US$258.5471.8% undervalued
2 followersusers have followed this narrative
0 commentsusers have commented on this narrative
0 likesusers have liked this narrative
LO


Lou_Basenese on Virtuix Holdings ·
From a “Shark Tank” Snub to an Air Force “Yes”: Why Virtuix at $3.50 May Be the Market’sMost Mispriced AI Story
Fair Value:US$7.551.2% undervalued
1 followerusers have followed this narrative
0 commentsusers have commented on this narrative
0 likesusers have liked this narrative
BR

browser on Space Exploration Technologies ·
SpaceX: A Sober Look at Catalysts, Risks, and Long‑Term Value After the IPO
Fair Value:US$0.4633.5k% overvalued
3 followersusers have followed this narrative
0 commentsusers have commented on this narrative
0 likesusers have liked this narrative
Popular Narratives
MA


martinarauz on Nu Holdings ·
Investment Analysis (May 2026)
Fair Value:US$22.7443.8% undervalued
67 followersusers have followed this narrative
0 commentsusers have commented on this narrative
16 likesusers have liked this narrative
HA


HarishPK on Adobe ·
Adobe: A Probabilistic Case for Undervaluation
Fair Value:US$319.9639.1% undervalued
60 followersusers have followed this narrative
9 commentsusers have commented on this narrative
17 likesusers have liked this narrative
NI


niteco on Honeywell International ·
Honeywell - The Demand-Side of the AI Infrastructure
Fair Value:US$320.1928.8% undervalued
52 followersusers have followed this narrative
0 commentsusers have commented on this narrative
19 likesusers have liked this narrative

