Advertisement
Haier Electronics Group (HKG:1169) Seems To Use Debt Rather Sparingly
David Iben put it well when he said, 'Volatility is not a risk we care about. What we care about is avoiding the permanent loss of capital. When we think about how risky a company is, we always like to look at its use of debt, since debt overload can lead to ruin. We note that Haier Electronics Group Co., Ltd. (HKG:1169) does have debt on its balance sheet. But the more important question is: how much risk is that debt creating?
Why Does Debt Bring Risk?
Debt is a tool to help businesses grow, but if a business is incapable of paying off its lenders, then it exists at their mercy. In the worst case scenario, a company can go bankrupt if it cannot pay its creditors. While that is not too common, we often do see indebted companies permanently diluting shareholders because lenders force them to raise capital at a distressed price. Of course, plenty of companies use debt to fund growth, without any negative consequences. When we think about a company's use of debt, we first look at cash and debt together.
View our latest analysis for Haier Electronics Group
What Is Haier Electronics Group's Net Debt?
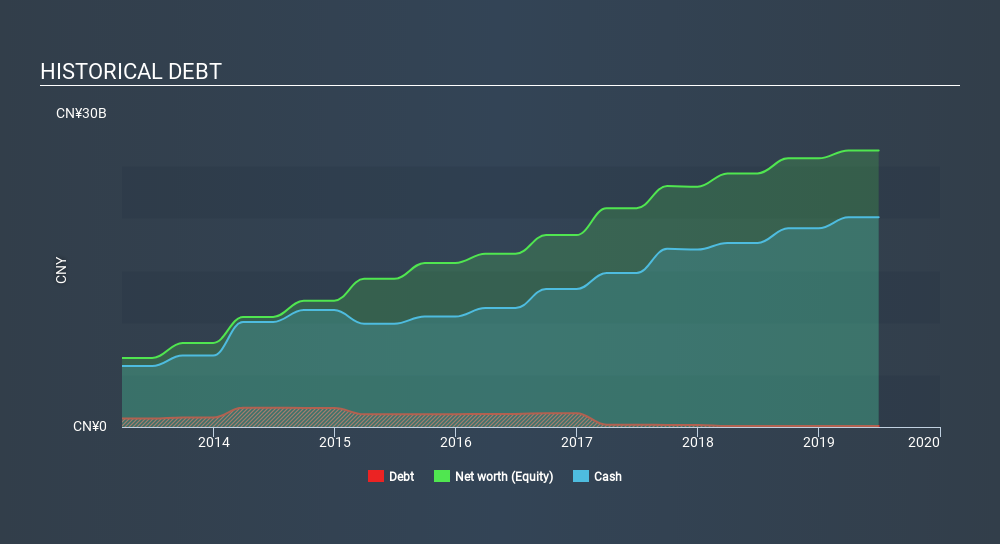
As you can see below, at the end of June 2019, Haier Electronics Group had CN¥100.1m of debt, up from CN¥90.1m a year ago. Click the image for more detail. But it also has CN¥20.1b in cash to offset that, meaning it has CN¥20.0b net cash.
How Healthy Is Haier Electronics Group's Balance Sheet?
According to the last reported balance sheet, Haier Electronics Group had liabilities of CN¥17.8b due within 12 months, and liabilities of CN¥3.01b due beyond 12 months. Offsetting this, it had CN¥20.1b in cash and CN¥5.41b in receivables that were due within 12 months. So it actually has CN¥4.69b more liquid assets than total liabilities.
This short term liquidity is a sign that Haier Electronics Group could probably pay off its debt with ease, as its balance sheet is far from stretched. Simply put, the fact that Haier Electronics Group has more cash than debt is arguably a good indication that it can manage its debt safely.
While Haier Electronics Group doesn't seem to have gained much on the EBIT line, at least earnings remain stable for now. When analysing debt levels, the balance sheet is the obvious place to start. But ultimately the future profitability of the business will decide if Haier Electronics Group can strengthen its balance sheet over time. So if you're focused on the future you can check out this free report showing analyst profit forecasts.
But our final consideration is also important, because a company cannot pay debt with paper profits; it needs cold hard cash. Haier Electronics Group may have net cash on the balance sheet, but it is still interesting to look at how well the business converts its earnings before interest and tax (EBIT) to free cash flow, because that will influence both its need for, and its capacity to manage debt. Over the last three years, Haier Electronics Group recorded free cash flow worth a fulsome 87% of its EBIT, which is stronger than we'd usually expect. That puts it in a very strong position to pay down debt.
Summing up
While it is always sensible to investigate a company's debt, in this case Haier Electronics Group has CN¥20.0b in net cash and a decent-looking balance sheet. The cherry on top was that in converted 87% of that EBIT to free cash flow, bringing in CN¥2.9b. So is Haier Electronics Group's debt a risk? It doesn't seem so to us. Above most other metrics, we think its important to track how fast earnings per share is growing, if at all. If you've also come to that realization, you're in luck, because today you can view this interactive graph of Haier Electronics Group's earnings per share history for free.
Of course, if you're the type of investor who prefers buying stocks without the burden of debt, then don't hesitate to discover our exclusive list of net cash growth stocks, today.
If you spot an error that warrants correction, please contact the editor at editorial-team@simplywallst.com. This article by Simply Wall St is general in nature. It does not constitute a recommendation to buy or sell any stock, and does not take account of your objectives, or your financial situation. Simply Wall St has no position in the stocks mentioned.
We aim to bring you long-term focused research analysis driven by fundamental data. Note that our analysis may not factor in the latest price-sensitive company announcements or qualitative material. Thank you for reading.
Market Insights


Advertisement
Weekly Picks
CE


Ceazar on Sparc AI ·
When GPS fails: this small cap is fixing a $54B drone problem
Fair Value:CA$5.2540.0% undervalued
74 followersusers have followed this narrative
0 commentsusers have commented on this narrative
18 likesusers have liked this narrative
HE


HedgeY on IonQ ·
The Best-Funded Quantum Platform and Still a Stock Priced for Perfection
Fair Value:US$482.3% overvalued
30 followersusers have followed this narrative
0 commentsusers have commented on this narrative
8 likesusers have liked this narrative
BL


BlackGoat on Cerebras Systems ·
The Wafer Giant Threatening NVIDIA's GPU Hegemony
Fair Value:US$415.5450.7% undervalued
53 followersusers have followed this narrative
1 commentusers have commented on this narrative
7 likesusers have liked this narrative
IV

Ivoed on Netflix ·
Netflix’s Business Quality Is Clear. The Harder Question Is Whether The Stock Is Still Cheap
Fair Value:US$825.3% undervalued
27 followersusers have followed this narrative
2 commentsusers have commented on this narrative
8 likesusers have liked this narrative
Recently Updated Narratives
DR


DrPotato on TeamViewer ·
TeamViewer Set to Evolve from Stagnation to Enterprise Growth by 2028
Fair Value:€13.3260.9% undervalued
2 followersusers have followed this narrative
0 commentsusers have commented on this narrative
0 likesusers have liked this narrative
JO


John_Eric on Veeva Systems ·
AI-Powered Veeva Systems Poised for Solid Growth Amid Regulatory Stability
Fair Value:US$32039.8% undervalued
1 followerusers have followed this narrative
0 commentsusers have commented on this narrative
0 likesusers have liked this narrative
EU


European_Hidden_Gem_Stocks on Creotech Instruments ·
$CRI Creotech Instruments (WSE:CRI): Two Minute Drill
Fair Value:zł822.191.8% undervalued
1 followerusers have followed this narrative
0 commentsusers have commented on this narrative
0 likesusers have liked this narrative
Popular Narratives
IN


Investingwilly on Mastercard ·
Mastercard: The Best Dividend Stock You're Ignoring
Fair Value:US$75028.1% undervalued
80 followersusers have followed this narrative
1 commentusers have commented on this narrative
9 likesusers have liked this narrative
HA


HarishPK on Adobe ·
Adobe: A Probabilistic Case for Undervaluation
Fair Value:US$319.9631.3% undervalued
63 followersusers have followed this narrative
9 commentsusers have commented on this narrative
19 likesusers have liked this narrative
NI


niteco on Broadcom ·
A Capital Allocation Favorite with Structural Importance
Fair Value:US$651.0544.6% undervalued
55 followersusers have followed this narrative
0 commentsusers have commented on this narrative
12 likesusers have liked this narrative
Trending Discussion

NO

Nominal_Llama_qnhq on Kratos Defense & Security Solutions ·
Has anyone determined why many of the KTOS insiders are selling so much of their stock holdings. It...
0
|0
