Advertisement
- Australia
- /
- Consumer Finance
- /
- ASX:HUM
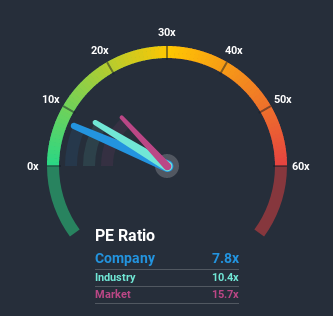
FlexiGroup Limited's (ASX:FXL) Low P/E No Reason For Excitement
With a price-to-earnings (or "P/E") ratio of 7.8x FlexiGroup Limited (ASX:FXL) may be sending very bullish signals at the moment, given that almost half of all companies in Australia have P/E ratios greater than 16x and even P/E's higher than 30x are not unusual. Nonetheless, we'd need to dig a little deeper to determine if there is a rational basis for the highly reduced P/E.
FlexiGroup could be doing better as its earnings have been going backwards lately while most other companies have been seeing positive earnings growth. The P/E is probably low because investors think this poor earnings performance isn't going to get any better. If you still like the company, you'd be hoping this isn't the case so that you could potentially pick up some stock while it's out of favour.
View our latest analysis for FlexiGroup
How Does FlexiGroup's P/E Ratio Compare To Its Industry Peers?
It's plausible that FlexiGroup's particularly low P/E ratio could be a result of tendencies within its own industry. The image below shows that the Consumer Finance industry as a whole also has a P/E ratio lower than the market. So it appears the company's ratio could be influenced somewhat by these industry numbers currently. Some industry P/E's don't move around a lot and right now most companies within the Consumer Finance industry should be getting stifled. Still, the strength of the company's earnings will most likely determine where its P/E shall sit.
Does Growth Match The Low P/E?
There's an inherent assumption that a company should far underperform the market for P/E ratios like FlexiGroup's to be considered reasonable.
If we review the last year of earnings, dishearteningly the company's profits fell to the tune of 15%. At least EPS has managed not to go completely backwards from three years ago in aggregate, thanks to the earlier period of growth. Accordingly, shareholders probably wouldn't have been overly satisfied with the unstable medium-term growth rates.
Shifting to the future, estimates from the four analysts covering the company suggest earnings should grow by 2.1% per year over the next three years. Meanwhile, the rest of the market is forecast to expand by 12% each year, which is noticeably more attractive.
With this information, we can see why FlexiGroup is trading at a P/E lower than the market. It seems most investors are expecting to see limited future growth and are only willing to pay a reduced amount for the stock.
The Final Word
While the price-to-earnings ratio shouldn't be the defining factor in whether you buy a stock or not, it's quite a capable barometer of earnings expectations.
We've established that FlexiGroup maintains its low P/E on the weakness of its forecast growth being lower than the wider market, as expected. At this stage investors feel the potential for an improvement in earnings isn't great enough to justify a higher P/E ratio. It's hard to see the share price rising strongly in the near future under these circumstances.
And what about other risks? Every company has them, and we've spotted 3 warning signs for FlexiGroup (of which 1 is significant!) you should know about.
Of course, you might find a fantastic investment by looking at a few good candidates. So take a peek at this free list of companies with a strong growth track record, trading on a P/E below 20x.
If you’re looking to trade FlexiGroup, open an account with the lowest-cost* platform trusted by professionals, Interactive Brokers. Their clients from over 200 countries and territories trade stocks, options, futures, forex, bonds and funds worldwide from a single integrated account.Promoted
Valuation is complex, but we're here to simplify it.
Discover if Humm Group might be undervalued or overvalued with our detailed analysis, featuring fair value estimates, potential risks, dividends, insider trades, and its financial condition.
Access Free AnalysisThis article by Simply Wall St is general in nature. It does not constitute a recommendation to buy or sell any stock, and does not take account of your objectives, or your financial situation. We aim to bring you long-term focused analysis driven by fundamental data. Note that our analysis may not factor in the latest price-sensitive company announcements or qualitative material. Simply Wall St has no position in any stocks mentioned.
*Interactive Brokers Rated Lowest Cost Broker by StockBrokers.com Annual Online Review 2020
Have feedback on this article? Concerned about the content? Get in touch with us directly. Alternatively, email editorial-team@simplywallst.com.
About ASX:HUM
Humm Group
Provides various financial products and services in Australia, New Zealand, Ireland, the United Kingdom, and Canada.
High growth potential with excellent balance sheet.
Similar Companies
Market Insights

Advertisement
Weekly Picks
DA


davidlsander on Nevgold ·
The U.S. Government Is Desperate for This Metal. This Tiny Miner Has It -- Its Closest Peer Is Already Worth Double.
Fair Value:US$2.1946.6% undervalued
39 followersusers have followed this narrative
0 commentsusers have commented on this narrative
4 likesusers have liked this narrative
BE

benjamin_lvieq on PayPal Holdings ·
PayPal: PayPal Doesn't Need to Grow – It Needs to Stop Falling – A Mispriced Cash Machine With a Cannibal Buyback
Fair Value:US$6513.0% undervalued
63 followersusers have followed this narrative
2 commentsusers have commented on this narrative
9 likesusers have liked this narrative
JD

JD009 on Celsius Holdings ·
From $5M to $2B: Why the 2024 Crash Was the Best Buying Opportunity in Consumer Stocks
Fair Value:US$55.4347.7% undervalued
22 followersusers have followed this narrative
1 commentusers have commented on this narrative
8 likesusers have liked this narrative
WA

Wavefarer on Accenture ·
High-quality global services company facing an AI-driven valuation reset.
Fair Value:US$30152.3% undervalued
17 followersusers have followed this narrative
1 commentusers have commented on this narrative
6 likesusers have liked this narrative
Recently Updated Narratives
ES

Esteban on Ross Stores ·
ROST offers strong downside protection with cash-rich balance sheet, dependable but modest compounding despite losing relative scale to TJX
Fair Value:US$74.69212.6% overvalued
1 followerusers have followed this narrative
0 commentsusers have commented on this narrative
0 likesusers have liked this narrative
AN


AntonioS on HealthCo Healthcare and Wellness REIT ·
The Discount Is Real — But Only If You Price the Exit, Not the Balance Sheet
Fair Value:AU$1.0733.2% undervalued
1 followerusers have followed this narrative
0 commentsusers have commented on this narrative
0 likesusers have liked this narrative
TR


tripledub on Netflix ·
Netflix's Attention Deficit: Pricing and Ads Racing Against View-Hour Stagnation
Fair Value:US$7710.5% undervalued
1 followerusers have followed this narrative
0 commentsusers have commented on this narrative
0 likesusers have liked this narrative
Popular Narratives
IN


Investingwilly on Mastercard ·
Mastercard: The Best Dividend Stock You're Ignoring
Fair Value:US$75027.5% undervalued
96 followersusers have followed this narrative
1 commentusers have commented on this narrative
9 likesusers have liked this narrative
BL


BlackGoat on Cerebras Systems ·
The Wafer Giant Threatening NVIDIA's GPU Hegemony
Fair Value:US$415.5458.4% undervalued
64 followersusers have followed this narrative
3 commentsusers have commented on this narrative
11 likesusers have liked this narrative
BE
benjamin_lvieq on PayPal Holdings ·
PayPal: PayPal Doesn't Need to Grow – It Needs to Stop Falling – A Mispriced Cash Machine With a Cannibal Buyback
Fair Value:US$6513.0% undervalued
63 followersusers have followed this narrative
2 commentsusers have commented on this narrative
9 likesusers have liked this narrative
Trending Discussion
BE
benjamin_lvieq on PayPal Holdings ·
An investment case is not about loving the product. Its about price vs reality.
2
|0
ST


StoxEurope on Koninklijke Ahold Delhaize ·
I ran Ahold Delhaize through a three-model triangulation — DCF, dividend discount, and residual inco...
1
|0