Advertisement
- United States
- /
- Communications
- /
- NasdaqGS:AUDC
Estimating The Fair Value Of AudioCodes Ltd. (NASDAQ:AUDC)
Today we'll do a simple run through of a valuation method used to estimate the attractiveness of AudioCodes Ltd. (NASDAQ:AUDC) as an investment opportunity by taking the foreast future cash flows of the company and discounting them back to today's value. I will use the Discounted Cash Flow (DCF) model. It may sound complicated, but actually it is quite simple!
We generally believe that a company's value is the present value of all of the cash it will generate in the future. However, a DCF is just one valuation metric among many, and it is not without flaws. If you want to learn more about discounted cash flow, the rationale behind this calculation can be read in detail in the Simply Wall St analysis model.
View our latest analysis for AudioCodes
The method
We're using the 2-stage growth model, which simply means we take in account two stages of company's growth. In the initial period the company may have a higher growth rate and the second stage is usually assumed to have a stable growth rate. In the first stage we need to estimate the cash flows to the business over the next ten years. Seeing as no analyst estimates of free cash flow are available to us, we have extrapolate the previous free cash flow (FCF) from the company's last reported value. We assume companies with shrinking free cash flow will slow their rate of shrinkage, and that companies with growing free cash flow will see their growth rate slow, over this period. We do this to reflect that growth tends to slow more in the early years than it does in later years.
A DCF is all about the idea that a dollar in the future is less valuable than a dollar today, so we need to discount the sum of these future cash flows to arrive at a present value estimate:
10-year free cash flow (FCF) estimate
| 2020 | 2021 | 2022 | 2023 | 2024 | 2025 | 2026 | 2027 | 2028 | 2029 | |
| Levered FCF ($, Millions) | US$38.3m | US$45.2m | US$51.3m | US$56.3m | US$60.4m | US$63.9m | US$66.8m | US$69.2m | US$71.4m | US$73.3m |
| Growth Rate Estimate Source | Est @ 25.28% | Est @ 18.22% | Est @ 13.27% | Est @ 9.81% | Est @ 7.39% | Est @ 5.7% | Est @ 4.51% | Est @ 3.68% | Est @ 3.1% | Est @ 2.69% |
| Present Value ($, Millions) Discounted @ 8.7% | US$35.2 | US$38.3 | US$39.9 | US$40.4 | US$39.9 | US$38.8 | US$37.3 | US$35.6 | US$33.8 | US$31.9 |
("Est" = FCF growth rate estimated by Simply Wall St)
Present Value of 10-year Cash Flow (PVCF) = US$371m
The second stage is also known as Terminal Value, this is the business's cash flow after the first stage. For a number of reasons a very conservative growth rate is used that cannot exceed that of a country's GDP growth. In this case we have used the 10-year government bond rate (1.7%) to estimate future growth. In the same way as with the 10-year 'growth' period, we discount future cash flows to today's value, using a cost of equity of 8.7%.
Terminal Value (TV)= FCF2029 × (1 + g) ÷ (r – g) = US$73m× (1 + 1.7%) ÷ 8.7%– 1.7%) = US$1.1b
Present Value of Terminal Value (PVTV)= TV / (1 + r)10= US$1.1b÷ ( 1 + 8.7%)10= US$469m
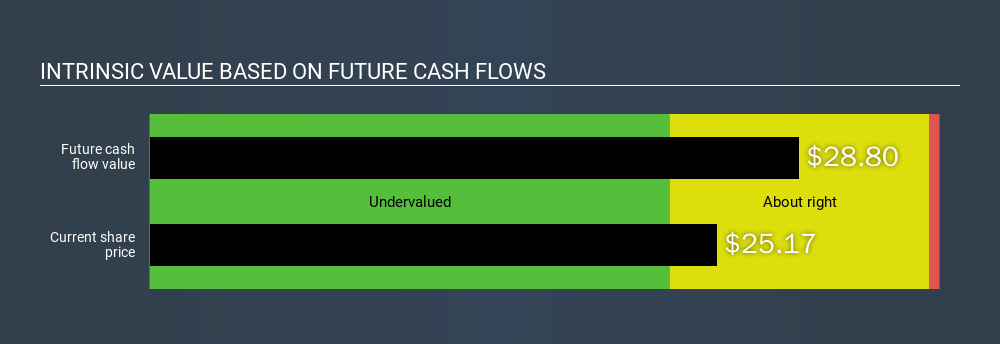
The total value is the sum of cash flows for the next ten years plus the discounted terminal value, which results in the Total Equity Value, which in this case is US$840m. To get the intrinsic value per share, we divide this by the total number of shares outstanding. Compared to the current share price of US$25.2, the company appears about fair value at a 13% discount to where the stock price trades currently. Remember though, that this is just an approximate valuation, and like any complex formula - garbage in, garbage out.
Important assumptions
We would point out that the most important inputs to a discounted cash flow are the discount rate and of course the actual cash flows. Part of investing is coming up with your own evaluation of a company's future performance, so try the calculation yourself and check your own assumptions. The DCF also does not consider the possible cyclicality of an industry, or a company's future capital requirements, so it does not give a full picture of a company's potential performance. Given that we are looking at AudioCodes as potential shareholders, the cost of equity is used as the discount rate, rather than the cost of capital (or weighted average cost of capital, WACC) which accounts for debt. In this calculation we've used 8.7%, which is based on a levered beta of 1.094. Beta is a measure of a stock's volatility, compared to the market as a whole. We get our beta from the industry average beta of globally comparable companies, with an imposed limit between 0.8 and 2.0, which is a reasonable range for a stable business.
Next Steps:
Whilst important, DCF calculation shouldn’t be the only metric you look at when researching a company. The DCF model is not a perfect stock valuation tool. Rather it should be seen as a guide to "what assumptions need to be true for this stock to be under/overvalued?" If a company grows at a different rate, or if its cost of equity or risk free rate changes sharply, the output can look very different. For AudioCodes, I've compiled three fundamental aspects you should look at:
- Financial Health: Does AUDC have a healthy balance sheet? Take a look at our free balance sheet analysis with six simple checks on key factors like leverage and risk.
- Future Earnings: How does AUDC's growth rate compare to its peers and the wider market? Dig deeper into the analyst consensus number for the upcoming years by interacting with our free analyst growth expectation chart.
- Other High Quality Alternatives: Are there other high quality stocks you could be holding instead of AUDC? Explore our interactive list of high quality stocks to get an idea of what else is out there you may be missing!
PS. Simply Wall St updates its DCF calculation for every US stock every day, so if you want to find the intrinsic value of any other stock just search here.
If you spot an error that warrants correction, please contact the editor at editorial-team@simplywallst.com. This article by Simply Wall St is general in nature. It does not constitute a recommendation to buy or sell any stock, and does not take account of your objectives, or your financial situation. Simply Wall St has no position in the stocks mentioned.
We aim to bring you long-term focused research analysis driven by fundamental data. Note that our analysis may not factor in the latest price-sensitive company announcements or qualitative material. Thank you for reading.
About NasdaqGS:AUDC
AudioCodes
Provides advanced communications software, products, and productivity solutions for the digital workplace worldwide.
Flawless balance sheet with moderate growth potential.
Similar Companies
Market Insights


Advertisement
Weekly Picks
LO


Lou_Basenese on Virtuix Holdings ·
From a “Shark Tank” Snub to an Air Force “Yes”: Why Virtuix at $3.50 May Be the Market’s Most Mispriced AI Story
Fair Value:US$7.562.8% undervalued
22 followersusers have followed this narrative
0 commentsusers have commented on this narrative
3 likesusers have liked this narrative
IN


Investingwilly on Mastercard ·
Mastercard: The Best Dividend Stock You're Ignoring
Fair Value:US$75033.5% undervalued
71 followersusers have followed this narrative
1 commentusers have commented on this narrative
9 likesusers have liked this narrative
TR


tripledub on Intuit ·
A Wonderful Business at a Not-So-Wonderful Price
Fair Value:US$56052.2% undervalued
64 followersusers have followed this narrative
4 commentsusers have commented on this narrative
30 likesusers have liked this narrative
TA


Talos on MindWalk Holdings ·
The Asymmetric TechBio Play: MindWalk Holdings and the Valuation Disconnect
Fair Value:US$8.2780.9% undervalued
35 followersusers have followed this narrative
0 commentsusers have commented on this narrative
9 likesusers have liked this narrative
Recently Updated Narratives
RO


RockeTeller on Orezone Gold ·
Orezone Gold Could 3X–5X, Bomboré Ramp + Casa Berardi Quebec Asset Delivers 160-180Koz in 2026
Fair Value:CA$10.6878.4% undervalued
11 followersusers have followed this narrative
4 commentsusers have commented on this narrative
1 likeusers have liked this narrative
IV

Ivoed on Netflix ·
Netflix’s Business Quality Is Clear. The Harder Question Is Whether The Stock Is Still Cheap
Fair Value:US$8210.0% undervalued
3 followersusers have followed this narrative
0 commentsusers have commented on this narrative
0 likesusers have liked this narrative
RO

RockeTeller on NeXGold Mining ·
NexGold Mining: 4.7Moz M&I Resources, $100M Cash + Debt-Free, Construction Decision 2026 Undervalued Canadian Gold Developer
Fair Value:CA$39.5296.9% undervalued
5 followersusers have followed this narrative
3 commentsusers have commented on this narrative
1 likeusers have liked this narrative
Popular Narratives
IN
Investingwilly on Mastercard ·
Mastercard: The Best Dividend Stock You're Ignoring
Fair Value:US$75033.5% undervalued
71 followersusers have followed this narrative
1 commentusers have commented on this narrative
9 likesusers have liked this narrative
HA


HarishPK on Adobe ·
Adobe: A Probabilistic Case for Undervaluation
Fair Value:US$319.9636.6% undervalued
62 followersusers have followed this narrative
9 commentsusers have commented on this narrative
19 likesusers have liked this narrative
MA


martinarauz on Nu Holdings ·
Investment Analysis (May 2026)
Fair Value:US$22.7442.1% undervalued
68 followersusers have followed this narrative
0 commentsusers have commented on this narrative
17 likesusers have liked this narrative
