- New Zealand
- /
- Telecom Services and Carriers
- /
- NZSE:SPK
Does Spark New Zealand Limited's (NZSE:SPK) P/E Ratio Signal A Buying Opportunity?

Today, we'll introduce the concept of the P/E ratio for those who are learning about investing. We'll apply a basic P/E ratio analysis to Spark New Zealand Limited's (NZSE:SPK), to help you decide if the stock is worth further research. Looking at earnings over the last twelve months, Spark New Zealand has a P/E ratio of 19.44. That is equivalent to an earnings yield of about 5.1%.
View our latest analysis for Spark New Zealand
How Do I Calculate A Price To Earnings Ratio?
The formula for P/E is:
Price to Earnings Ratio = Share Price ÷ Earnings per Share (EPS)
Or for Spark New Zealand:
P/E of 19.44 = NZ$4.33 ÷ NZ$0.22 (Based on the year to June 2019.)
Is A High P/E Ratio Good?
A higher P/E ratio means that investors are paying a higher price for each NZ$1 of company earnings. That isn't a good or a bad thing on its own, but a high P/E means that buyers have a higher opinion of the business's prospects, relative to stocks with a lower P/E.
How Does Spark New Zealand's P/E Ratio Compare To Its Peers?
The P/E ratio essentially measures market expectations of a company. We can see in the image below that the average P/E (31.8) for companies in the telecom industry is higher than Spark New Zealand's P/E.
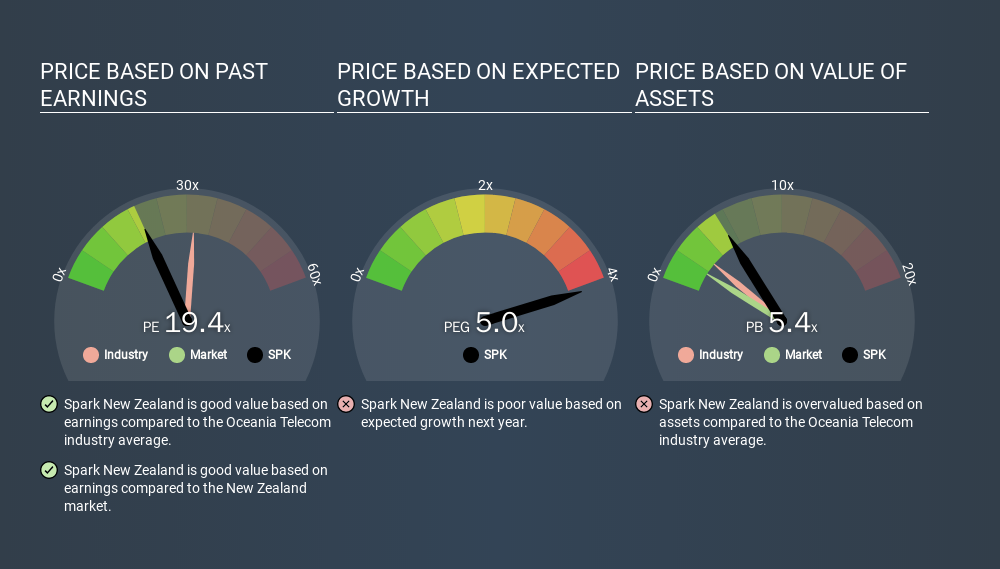
Spark New Zealand's P/E tells us that market participants think it will not fare as well as its peers in the same industry. Many investors like to buy stocks when the market is pessimistic about their prospects. If you consider the stock interesting, further research is recommended. For example, I often monitor director buying and selling.
How Growth Rates Impact P/E Ratios
Probably the most important factor in determining what P/E a company trades on is the earnings growth. If earnings are growing quickly, then the 'E' in the equation will increase faster than it would otherwise. Therefore, even if you pay a high multiple of earnings now, that multiple will become lower in the future. So while a stock may look expensive based on past earnings, it could be cheap based on future earnings.
Spark New Zealand increased earnings per share by an impressive 12% over the last twelve months. And its annual EPS growth rate over 5 years is 4.8%. So one might expect an above average P/E ratio.
Don't Forget: The P/E Does Not Account For Debt or Bank Deposits
One drawback of using a P/E ratio is that it considers market capitalization, but not the balance sheet. That means it doesn't take debt or cash into account. Hypothetically, a company could reduce its future P/E ratio by spending its cash (or taking on debt) to achieve higher earnings.
Such spending might be good or bad, overall, but the key point here is that you need to look at debt to understand the P/E ratio in context.
How Does Spark New Zealand's Debt Impact Its P/E Ratio?
Spark New Zealand's net debt is 18% of its market cap. It would probably deserve a higher P/E ratio if it was net cash, since it would have more options for growth.
The Verdict On Spark New Zealand's P/E Ratio
Spark New Zealand trades on a P/E ratio of 19.4, which is fairly close to the NZ market average of 19.4. With only modest debt levels, and strong earnings growth, the market seems to doubt that the growth can be maintained.
Investors have an opportunity when market expectations about a stock are wrong. If it is underestimating a company, investors can make money by buying and holding the shares until the market corrects itself. So this free visualization of the analyst consensus on future earnings could help you make the right decision about whether to buy, sell, or hold.
Of course, you might find a fantastic investment by looking at a few good candidates. So take a peek at this free list of companies with modest (or no) debt, trading on a P/E below 20.
If you spot an error that warrants correction, please contact the editor at editorial-team@simplywallst.com. This article by Simply Wall St is general in nature. It does not constitute a recommendation to buy or sell any stock, and does not take account of your objectives, or your financial situation. Simply Wall St has no position in the stocks mentioned.
We aim to bring you long-term focused research analysis driven by fundamental data. Note that our analysis may not factor in the latest price-sensitive company announcements or qualitative material. Thank you for reading.
About NZSE:SPK
Spark New Zealand
Provides telecommunications and digital services in New Zealand.
Adequate balance sheet average dividend payer.
Similar Companies
Market Insights

Weekly Picks

Early mover in a fast growing industry. Likely to experience share price volatility as they scale


A case for CA$31.80 (undiluted), aka 8,616% upside from CA$0.37 (an 86 bagger!).


Moderation and Stabilisation: HOLD: Fair Price based on a 4-year Cycle is $12.08
Recently Updated Narratives


Title: Market Sentiment Is Dead Wrong — Here's Why PSEC Deserves a Second Look


An amazing opportunity to potentially get a 100 bagger

Amazon: Why the World’s Biggest Platform Still Runs on Invisible Economics
Popular Narratives


MicroVision will explode future revenue by 380.37% with a vision towards success


Crazy Undervalued 42 Baggers Silver Play (Active & Running Mine)


NVDA: Expanding AI Demand Will Drive Major Data Center Investments Through 2026
Trending Discussion
