- Canada
- /
- Oil and Gas
- /
- TSX:GEI
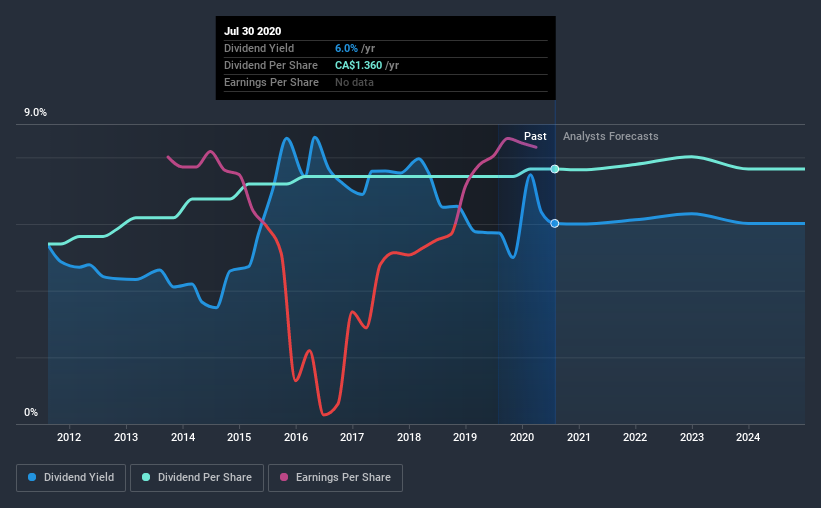
Does Gibson Energy Inc. (TSE:GEI) Have A Place In Your Dividend Portfolio?


Today we'll take a closer look at Gibson Energy Inc. (TSE:GEI) from a dividend investor's perspective. Owning a strong business and reinvesting the dividends is widely seen as an attractive way of growing your wealth. Yet sometimes, investors buy a stock for its dividend and lose money because the share price falls by more than they earned in dividend payments.
With a nine-year payment history and a 6.0% yield, many investors probably find Gibson Energy intriguing. It sure looks interesting on these metrics - but there's always more to the story. Some simple analysis can reduce the risk of holding Gibson Energy for its dividend, and we'll focus on the most important aspects below.
Click the interactive chart for our full dividend analysis
Payout ratios
Companies (usually) pay dividends out of their earnings. If a company is paying more than it earns, the dividend might have to be cut. Comparing dividend payments to a company's net profit after tax is a simple way of reality-checking whether a dividend is sustainable. In the last year, Gibson Energy paid out 115% of its profit as dividends. Unless there are extenuating circumstances, from the perspective of an investor who hopes to own the company for many years, a payout ratio of above 100% is definitely a concern.
Another important check we do is to see if the free cash flow generated is sufficient to pay the dividend. The company paid out 70% of its free cash flow, which is not bad per se, but does start to limit the amount of cash Gibson Energy has available to meet other needs. It's disappointing to see that the dividend was not covered by profits, but cash is more important from a dividend sustainability perspective, and Gibson Energy fortunately did generate enough cash to fund its dividend. Still, if the company repeatedly paid a dividend greater than its profits, we'd be concerned. Extraordinarily few companies are capable of persistently paying a dividend that is greater than their profits.
Is Gibson Energy's Balance Sheet Risky?
As Gibson Energy's dividend was not well covered by earnings, we need to check its balance sheet for signs of financial distress. A rough way to check this is with these two simple ratios: a) net debt divided by EBITDA (earnings before interest, tax, depreciation and amortisation), and b) net interest cover. Net debt to EBITDA is a measure of a company's total debt. Net interest cover measures the ability to meet interest payments. Essentially we check that a) the company does not have too much debt, and b) that it can afford to pay the interest. With net debt of 2.91 times its EBITDA, Gibson Energy's debt burden is within a normal range for most listed companies.
Net interest cover can be calculated by dividing earnings before interest and tax (EBIT) by the company's net interest expense. Interest cover of 3.61 times its interest expense is starting to become a concern for Gibson Energy, and be aware that lenders may place additional restrictions on the company as well.
Consider getting our latest analysis on Gibson Energy's financial position here.
Dividend Volatility
From the perspective of an income investor who wants to earn dividends for many years, there is not much point buying a stock if its dividend is regularly cut or is not reliable. Looking at the last decade of data, we can see that Gibson Energy paid its first dividend at least nine years ago. The company has been paying a stable dividend for a while now, which is great. However we'd prefer to see consistency for a few more years before giving it our full seal of approval. During the past nine-year period, the first annual payment was CA$1.0 in 2011, compared to CA$1.4 last year. This works out to be a compound annual growth rate (CAGR) of approximately 3.9% a year over that time.
Modest dividend growth is good to see, especially with the payments being relatively stable. However, the payment history is relatively short and we wouldn't want to rely on this dividend too much.
Dividend Growth Potential
Dividend payments have been consistent over the past few years, but we should always check if earnings per share (EPS) are growing, as this will help maintain the purchasing power of the dividend. Earnings have grown at around 9.1% a year for the past five years, which is better than seeing them shrink! Although per-share earnings are growing at a credible rate, virtually all of the income is being paid out as dividends to shareholders. This is okay, but may limit growth in the company's future dividend payments.
Conclusion
Dividend investors should always want to know if a) a company's dividends are affordable, b) if there is a track record of consistent payments, and c) if the dividend is capable of growing. We're not keen on the fact that Gibson Energy paid out such a high percentage of its income, although its cashflow is in better shape. Next, earnings growth has been good, but unfortunately the company has not been paying dividends as long as we'd like. Ultimately, Gibson Energy comes up short on our dividend analysis. It's not that we think it is a bad company - just that there are likely more appealing dividend prospects out there on this analysis.
It's important to note that companies having a consistent dividend policy will generate greater investor confidence than those having an erratic one. However, there are other things to consider for investors when analysing stock performance. To that end, Gibson Energy has 2 warning signs (and 1 which is significant) we think you should know about.
Looking for more high-yielding dividend ideas? Try our curated list of dividend stocks with a yield above 3%.
If you decide to trade Gibson Energy, use the lowest-cost* platform that is rated #1 Overall by Barron’s, Interactive Brokers. Trade stocks, options, futures, forex, bonds and funds on 135 markets, all from a single integrated account. Promoted
New: Manage All Your Stock Portfolios in One Place
We've created the ultimate portfolio companion for stock investors, and it's free.
• Connect an unlimited number of Portfolios and see your total in one currency
• Be alerted to new Warning Signs or Risks via email or mobile
• Track the Fair Value of your stocks
This article by Simply Wall St is general in nature. It does not constitute a recommendation to buy or sell any stock, and does not take account of your objectives, or your financial situation. We aim to bring you long-term focused analysis driven by fundamental data. Note that our analysis may not factor in the latest price-sensitive company announcements or qualitative material. Simply Wall St has no position in any stocks mentioned.
*Interactive Brokers Rated Lowest Cost Broker by StockBrokers.com Annual Online Review 2020
Have feedback on this article? Concerned about the content? Get in touch with us directly. Alternatively, email editorial-team@simplywallst.com.
About TSX:GEI
Gibson Energy
Engages in the gathering, storing, optimizing, and processing of liquids and refined products in Canada and the United States.
Established dividend payer with moderate growth potential.
Similar Companies
Market Insights

Community Narratives

