
Advertisement
- United States
- /
- Hospitality
- /
- NYSE:EAT
Does Brinker International, Inc. (NYSE:EAT) Have A Place In Your Dividend Portfolio?

Could Brinker International, Inc. (NYSE:EAT) be an attractive dividend share to own for the long haul? Investors are often drawn to strong companies with the idea of reinvesting the dividends. If you are hoping to live on your dividends, it's important to be more stringent with your investments than the average punter. Regular readers know we like to apply the same approach to each dividend stock, and we hope you'll find our analysis useful.
A high yield and a long history of paying dividends is an appealing combination for Brinker International. It would not be a surprise to discover that many investors buy it for the dividends. The company also bought back stock equivalent to around 11% of market capitalisation this year. Some simple analysis can offer a lot of insights when buying a company for its dividend, and we'll go through this below.
Click the interactive chart for our full dividend analysis
Payout ratios
Companies (usually) pay dividends out of their earnings. If a company is paying more than it earns, the dividend might have to be cut. Comparing dividend payments to a company's net profit after tax is a simple way of reality-checking whether a dividend is sustainable. Looking at the data, we can see that 38% of Brinker International's profits were paid out as dividends in the last 12 months. A medium payout ratio strikes a good balance between paying dividends, and keeping enough back to invest in the business. Plus, there is room to increase the payout ratio over time.
Another important check we do is to see if the free cash flow generated is sufficient to pay the dividend. Brinker International paid out 134% of its free cash last year. Cash flows can be lumpy, but this dividend was not well covered by cash flow. Paying out such a high percentage of cash flow suggests that the dividend was funded from either cash at bank or by borrowing, neither of which is desirable over the long term. Brinker International paid out less in dividends than it reported in profits, but unfortunately it didn't generate enough free cash flow to cover the dividend. Were it to repeatedly pay dividends that were not well covered by cash flow, this could be a risk to Brinker International's ability to maintain its dividend.
Is Brinker International's Balance Sheet Risky?
As Brinker International has a meaningful amount of debt, we need to check its balance sheet to see if the company might have debt risks. A quick check of its financial situation can be done with two ratios: net debt divided by EBITDA (earnings before interest, tax, depreciation and amortisation), and net interest cover. Net debt to EBITDA measures total debt load relative to company earnings (lower = less debt), while net interest cover measures the ability to pay interest on the debt (higher = greater ability to pay interest costs). Brinker International has net debt of 3.09 times its EBITDA, which is getting towards the limit of most investors' comfort zones. Judicious use of debt can enhance shareholder returns, but also adds to the risk if something goes awry.
We calculated its interest cover by measuring its earnings before interest and tax (EBIT), and dividing this by the company's net interest expense. With EBIT of 3.67 times its interest expense, Brinker International's interest cover is starting to look a bit thin.
Dividend Volatility
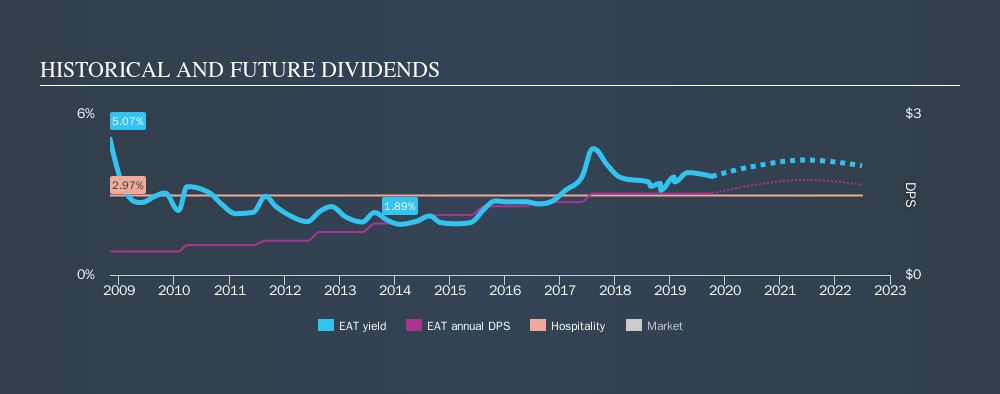
Before buying a stock for its income, we want to see if the dividends have been stable in the past, and if the company has a track record of maintaining its dividend. For the purpose of this article, we only scrutinise the last decade of Brinker International's dividend payments. The dividend has been stable over the past 10 years, which is great. We think this could suggest some resilience to the business and its dividends. During the past ten-year period, the first annual payment was US$0.44 in 2009, compared to US$1.52 last year. Dividends per share have grown at approximately 13% per year over this time.
Dividends have been growing pretty quickly, and even more impressively, they haven't experienced any notable falls during this period.
Dividend Growth Potential
Dividend payments have been consistent over the past few years, but we should always check if earnings per share (EPS) are growing, as this will help maintain the purchasing power of the dividend. It's good to see Brinker International has been growing its earnings per share at 12% a year over the past five years. Earnings per share have been growing at a good rate, and the company is paying less than half its earnings as dividends. We generally think this is an attractive combination, as it permits further reinvestment in the business.
Conclusion
To summarise, shareholders should always check that Brinker International's dividends are affordable, that its dividend payments are relatively stable, and that it has decent prospects for growing its earnings and dividend. Brinker International has a low payout ratio, which we like, although it paid out virtually all of its generated cash. That said, we were glad to see it growing earnings and paying a fairly consistent dividend. Overall we think Brinker International is an interesting dividend stock, although it could be better.
Earnings growth generally bodes well for the future value of company dividend payments. See if the 20 Brinker International analysts we track are forecasting continued growth with our free report on analyst estimates for the company.
We have also put together a list of global stocks with a market capitalisation above $1bn and yielding more 3%.
We aim to bring you long-term focused research analysis driven by fundamental data. Note that our analysis may not factor in the latest price-sensitive company announcements or qualitative material.
If you spot an error that warrants correction, please contact the editor at editorial-team@simplywallst.com. This article by Simply Wall St is general in nature. It does not constitute a recommendation to buy or sell any stock, and does not take account of your objectives, or your financial situation. Simply Wall St has no position in the stocks mentioned. Thank you for reading.
About NYSE:EAT
Brinker International
Engages in the ownership, development, operation, and franchising of casual dining restaurants in the United States and internationally.
Solid track record and fair value.
Similar Companies
Market Insights

Advertisement
Community Narratives
Vita Life Sciences Set for a 12.72% Revenue Growth While Tackling Operational Challenges
Fair Value AU$2.42|9.1% undervalued
RO
Community Contributor
Vossloh rides a €500 billion wave to boost growth and earnings in the next decade
Fair Value €78.41|5.2% undervalued
CH
Community Contributor
Intuitive Surgical Will Transform Healthcare with 12% Revenue Growth
Fair Value US$325.55|57.3% overvalued
UN
Community Contributor