
Advertisement
Do You Like Innovana Thinklabs Limited (NSE:INNOVANA) At This P/E Ratio?

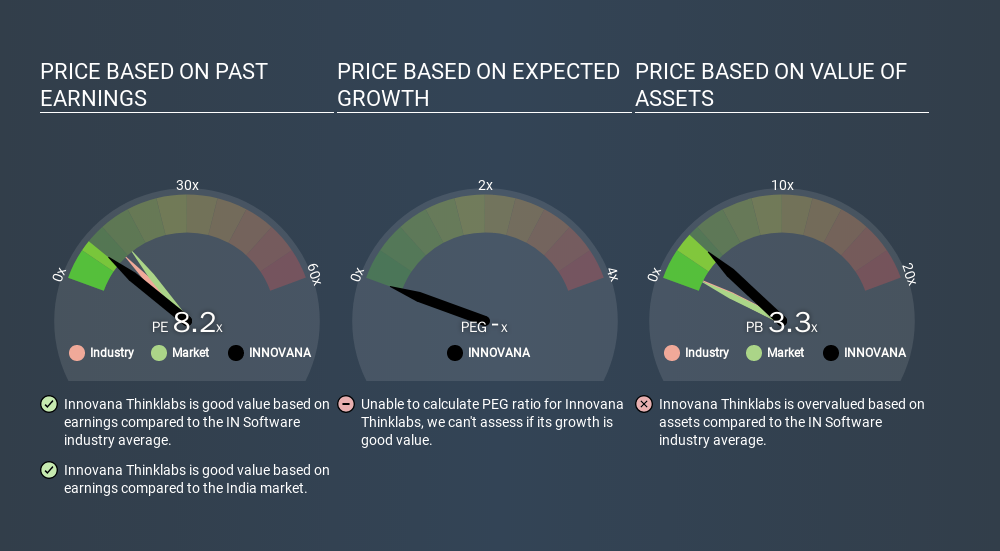
The goal of this article is to teach you how to use price to earnings ratios (P/E ratios). We'll apply a basic P/E ratio analysis to Innovana Thinklabs Limited's (NSE:INNOVANA), to help you decide if the stock is worth further research. Innovana Thinklabs has a price to earnings ratio of 8.19, based on the last twelve months. In other words, at today's prices, investors are paying ₹8.19 for every ₹1 in prior year profit.
View our latest analysis for Innovana Thinklabs
How Do I Calculate A Price To Earnings Ratio?
The formula for P/E is:
Price to Earnings Ratio = Share Price ÷ Earnings per Share (EPS)
Or for Innovana Thinklabs:
P/E of 8.19 = ₹126.50 ÷ ₹15.45 (Based on the trailing twelve months to September 2019.)
Is A High Price-to-Earnings Ratio Good?
A higher P/E ratio implies that investors pay a higher price for the earning power of the business. That isn't necessarily good or bad, but a high P/E implies relatively high expectations of what a company can achieve in the future.
How Does Innovana Thinklabs's P/E Ratio Compare To Its Peers?
We can get an indication of market expectations by looking at the P/E ratio. If you look at the image below, you can see Innovana Thinklabs has a lower P/E than the average (11.3) in the software industry classification.
This suggests that market participants think Innovana Thinklabs will underperform other companies in its industry. Many investors like to buy stocks when the market is pessimistic about their prospects. If you consider the stock interesting, further research is recommended. For example, I often monitor director buying and selling.
How Growth Rates Impact P/E Ratios
Probably the most important factor in determining what P/E a company trades on is the earnings growth. If earnings are growing quickly, then the 'E' in the equation will increase faster than it would otherwise. That means unless the share price increases, the P/E will reduce in a few years. Then, a lower P/E should attract more buyers, pushing the share price up.
Innovana Thinklabs's earnings made like a rocket, taking off 74% last year. The cherry on top is that the five year growth rate was an impressive 60% per year. With that kind of growth rate we would generally expect a high P/E ratio.
Remember: P/E Ratios Don't Consider The Balance Sheet
It's important to note that the P/E ratio considers the market capitalization, not the enterprise value. So it won't reflect the advantage of cash, or disadvantage of debt. Theoretically, a business can improve its earnings (and produce a lower P/E in the future) by investing in growth. That means taking on debt (or spending its cash).
Such expenditure might be good or bad, in the long term, but the point here is that the balance sheet is not reflected by this ratio.
So What Does Innovana Thinklabs's Balance Sheet Tell Us?
Innovana Thinklabs has net cash of ₹391m. This is fairly high at 30% of its market capitalization. That might mean balance sheet strength is important to the business, but should also help push the P/E a bit higher than it would otherwise be.
The Bottom Line On Innovana Thinklabs's P/E Ratio
Innovana Thinklabs's P/E is 8.2 which is below average (13.6) in the IN market. It grew its EPS nicely over the last year, and the healthy balance sheet implies there is more potential for growth. One might conclude that the market is a bit pessimistic, given the low P/E ratio.
Investors should be looking to buy stocks that the market is wrong about. If it is underestimating a company, investors can make money by buying and holding the shares until the market corrects itself. We don't have analyst forecasts, but shareholders might want to examine this detailed historical graph of earnings, revenue and cash flow.
Of course, you might find a fantastic investment by looking at a few good candidates. So take a peek at this free list of companies with modest (or no) debt, trading on a P/E below 20.
If you spot an error that warrants correction, please contact the editor at editorial-team@simplywallst.com. This article by Simply Wall St is general in nature. It does not constitute a recommendation to buy or sell any stock, and does not take account of your objectives, or your financial situation. Simply Wall St has no position in the stocks mentioned.
We aim to bring you long-term focused research analysis driven by fundamental data. Note that our analysis may not factor in the latest price-sensitive company announcements or qualitative material. Thank you for reading.
About NSEI:INNOVANA
Innovana Thinklabs
Engages in the software and application development business in India, the United States, and internationally.
Excellent balance sheet with proven track record.
Similar Companies
Market Insights


Advertisement
Community Narratives
For the Emperor: Why Games Workshop Could Be a Star Investment
Fair Value UK£160.00|0.4% undervalued
RO
Community Contributor
Securitas will boost margins with AI and tech-driven services
Fair Value SEK 260.91|45.0% undervalued
UN
Community Contributor
A Leader in EV Charging with Growth Potential
Fair Value €27.00|20.4% undervalued
TI
Community Contributor