
Advertisement
- Switzerland
- /
- Machinery
- /
- SWX:STRN
Do You Know What Schlatter Industries AG's (VTX:STRN) P/E Ratio Means?
This article is for investors who would like to improve their understanding of price to earnings ratios (P/E ratios). We'll apply a basic P/E ratio analysis to Schlatter Industries AG's (VTX:STRN), to help you decide if the stock is worth further research. Schlatter Industries has a P/E ratio of 12.24, based on the last twelve months. That is equivalent to an earnings yield of about 8.2%.
View our latest analysis for Schlatter Industries
How Do I Calculate A Price To Earnings Ratio?
The formula for P/E is:
Price to Earnings Ratio = Price per Share ÷ Earnings per Share (EPS)
Or for Schlatter Industries:
P/E of 12.24 = CHF36.00 ÷ CHF2.94 (Based on the trailing twelve months to June 2019.)
Is A High P/E Ratio Good?
A higher P/E ratio implies that investors pay a higher price for the earning power of the business. All else being equal, it's better to pay a low price -- but as Warren Buffett said, 'It's far better to buy a wonderful company at a fair price than a fair company at a wonderful price'.
How Does Schlatter Industries's P/E Ratio Compare To Its Peers?
We can get an indication of market expectations by looking at the P/E ratio. If you look at the image below, you can see Schlatter Industries has a lower P/E than the average (21.9) in the machinery industry classification.
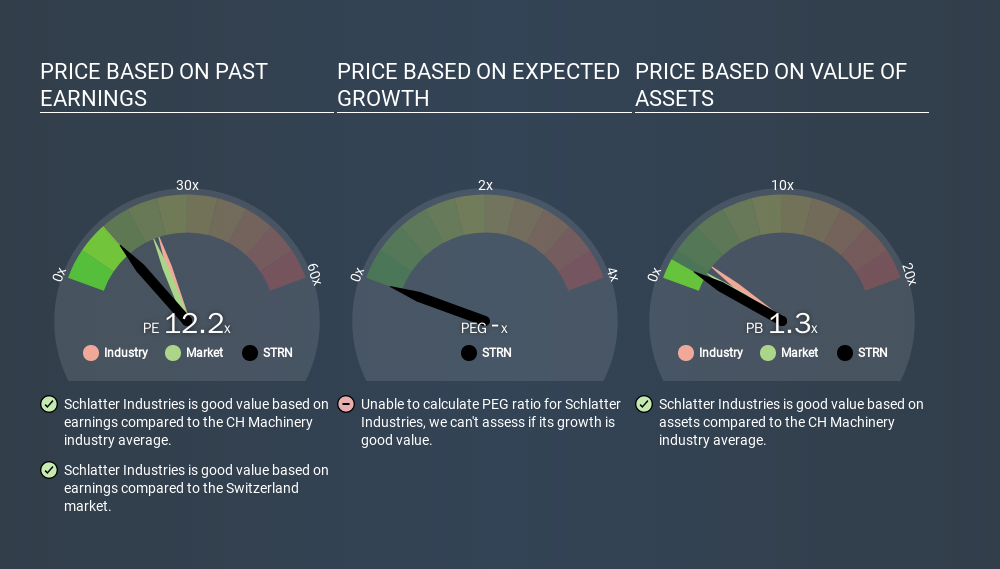
This suggests that market participants think Schlatter Industries will underperform other companies in its industry. While current expectations are low, the stock could be undervalued if the situation is better than the market assumes. It is arguably worth checking if insiders are buying shares, because that might imply they believe the stock is undervalued.
How Growth Rates Impact P/E Ratios
Probably the most important factor in determining what P/E a company trades on is the earnings growth. When earnings grow, the 'E' increases, over time. And in that case, the P/E ratio itself will drop rather quickly. And as that P/E ratio drops, the company will look cheap, unless its share price increases.
Schlatter Industries shrunk earnings per share by 4.4% last year.
Remember: P/E Ratios Don't Consider The Balance Sheet
It's important to note that the P/E ratio considers the market capitalization, not the enterprise value. In other words, it does not consider any debt or cash that the company may have on the balance sheet. The exact same company would hypothetically deserve a higher P/E ratio if it had a strong balance sheet, than if it had a weak one with lots of debt, because a cashed up company can spend on growth.
While growth expenditure doesn't always pay off, the point is that it is a good option to have; but one that the P/E ratio ignores.
Schlatter Industries's Balance Sheet
Since Schlatter Industries holds net cash of CHF934k, it can spend on growth, justifying a higher P/E ratio than otherwise.
The Verdict On Schlatter Industries's P/E Ratio
Schlatter Industries has a P/E of 12.2. That's below the average in the CH market, which is 20.6. The recent drop in earnings per share would almost certainly temper expectations, the relatively strong balance sheet will allow the company time to invest in growth. If it achieves that, then there's real potential that the low P/E could eventually indicate undervaluation.
Investors should be looking to buy stocks that the market is wrong about. If the reality for a company is not as bad as the P/E ratio indicates, then the share price should increase as the market realizes this. We don't have analyst forecasts, but shareholders might want to examine this detailed historical graph of earnings, revenue and cash flow.
But note: Schlatter Industries may not be the best stock to buy. So take a peek at this free list of interesting companies with strong recent earnings growth (and a P/E ratio below 20).
If you spot an error that warrants correction, please contact the editor at editorial-team@simplywallst.com. This article by Simply Wall St is general in nature. It does not constitute a recommendation to buy or sell any stock, and does not take account of your objectives, or your financial situation. Simply Wall St has no position in the stocks mentioned.
We aim to bring you long-term focused research analysis driven by fundamental data. Note that our analysis may not factor in the latest price-sensitive company announcements or qualitative material. Thank you for reading.
M

The Foxhole
The rate hike just raised the bar every company you own has to clear before spending.
46
s
sean_3pk06
If inflation is coming from an energy shock and a supply squeeze, what does an overnight rate do about it? You cannot raise rates at a pipeline.
d
devon_jd150
Constellation Software is one of my favorite capital allocators.
 Andrew Legget
Market Insights
Are social media stocks the new Big Tobacco?

Greater regulatory scrutiny is catching up with digital platforms, posing a rising risk for social media stocks. But as Big Tobacco discovered, that's not always a bad outcome for shareholders.
14
About SWX:STRN
Schlatter Industries
Manufactures and sells welding and weaving machines worldwide.
Flawless balance sheet and slightly overvalued.
Market Insights


Advertisement
Weekly Picks
CE


Ceazar on Sparc AI ·
When GPS fails: this small cap is fixing a $54B drone problem
Fair Value:CA$5.2537.3% undervalued
199 followersusers have followed this narrative
0 commentsusers have commented on this narrative
30 likesusers have liked this narrative
CO


composite32 on Archrock ·
AI Needs Power. Power Needs Gas. Gas Needs Compression: The Archrock Investment Thesis
Fair Value:US$44.8830.8% undervalued
23 followersusers have followed this narrative
2 commentsusers have commented on this narrative
3 likesusers have liked this narrative
JO


John_Eric on Advanced Energy Industries ·
AEIS Is Firing on Every Cylinder. My Problem Is the Safety Factor.
Fair Value:US$567.8655.6% undervalued
13 followersusers have followed this narrative
0 commentsusers have commented on this narrative
7 likesusers have liked this narrative
IS

isidrohg on Lam Research ·
The Memory Shortage Is Lam's Order Book — Whether It Persists Or Resolves
Fair Value:US$423.8536.5% undervalued
20 followersusers have followed this narrative
0 commentsusers have commented on this narrative
6 likesusers have liked this narrative
Recently Updated Narratives
TR


TripleS on Vizsla Silver ·
I own Vizsla Silver and I’m short the Dec 2026 $4 calls at $0.50 and long the Dec 2027 $5/$7.50 call spread at $0.40, a 6.25x max payoff if
Fair Value:CA$7.531.3% undervalued
1 followerusers have followed this narrative
0 commentsusers have commented on this narrative
0 likesusers have liked this narrative
AS


AstrisCorporateAdvisory on INTLOOP ·
Renewed focus on business investment
Fair Value:JP¥4.17k43.8% undervalued
3 followersusers have followed this narrative
0 commentsusers have commented on this narrative
0 likesusers have liked this narrative
ON

Ontological on Lineage ·
Lineage Inc, International Cold-Storage Giant Building its REIT
Fair Value:US$128.4570.5% undervalued
1 followerusers have followed this narrative
0 commentsusers have commented on this narrative
0 likesusers have liked this narrative
Popular Narratives
AN


AnalystConsensusTarget on NVIDIA ·
NVDA: Expanding AI Demand Will Drive Major Data Center Investments Through 2026
Fair Value:US$302.8329.4% undervalued
1463 followersusers have followed this narrative
8 commentsusers have commented on this narrative
35 likesusers have liked this narrative
AN

AnalystConsensusTarget on Alphabet ·
GOOGL: AI Platform Expansion And Cloud Demand Will Support Durable Performance Amid Competitive Pressures
Fair Value:US$427.8919.9% undervalued
1636 followersusers have followed this narrative
0 commentsusers have commented on this narrative
19 likesusers have liked this narrative
AN

AnalystConsensusTarget on Amazon.com ·
AMZN: Acceleration In Cloud And AI Will Drive Margin Expansion Ahead
Fair Value:US$32724.8% undervalued
1649 followersusers have followed this narrative
1 commentusers have commented on this narrative
16 likesusers have liked this narrative
Trending Discussion
AN

anthony_x0j2w on Platform Group SE KGaA ·
Hello,(I am a shareholder).I spent the summer investigating in whatever I was able to find in the press, the trustee, or legal, and comparing it to FS Benner's declaration/transcripts:press: MM has a tendancy to use facts, modify them and turn them the way they want: 100% of their claims against TPG0 is traçable factually, 80% is flawed and interpreted. Example are numerous: 11M loans banks to be paid seems right, but it has not been an issue at all, it has been paid in full. (and it happens all the time in every business...); the previous HR becoming a financial director in the article herself being attacked by TPG on the legal side; the wrong address of curator (if truly announced by TPG).Trustee: according to my research (which can be incomplete) no communication to the Nordic trustee (hereby, bond holders) has been done on a, indebtedness (late payment) > 1M€, which is their obligation by contract (clause 14.d - https://corporate.the-platform-group.com/bond/) => this is a sign of a huge lie and fraud, or the sign that there is no indebtedness > 1M€ over the whole TPG group.Legal: still awaiting for an answer, probable that I won't get it.VALUATIONYou can spent hours working the fundamentals, if they're flawed...the thesis falls.Anyway, I always substracts the badwill (that I consider non-current - you have it in the CFS) & non-controlling interests from my valuation:Earnings ~22MFCF ~40M€The financial statements are not the issue here, we are more on an cheap option on the sincerity of the accounts that a real valuation. Unfortunately, these are unverifiable elements, hence the low price./!\ Careful:the accounts are consolidated and skip the subsidiaries issues...Careful with the business model: TPG0 is a financial holding that acquire subsidiaries, hold the debt, and has no operations. 100% of the Cash Flow comes from subs' dividends => it is a risk here, more a plumber risk than an operational one, but nevertheless...The auditor is too small, and managed by the same firm than before, with 140K€/year commission => it's too low, nobody external really reviewed what Benner and his team are doing internallycapital increase do not go through the CFS, but through change in equity AND equity in the BSIf the equity stays low too long, the WACC increase will be unbearable (I have a 30% global, with a 118% on equity): diluting is expensive => TPG machine can stay broken for a while.Most of the people I talk with never saw this, while this is ESSENTIAL to Benner's business model.SEVERAL EVENTS THAT COULD CHANGE:AEP is being audited by KPMG: if Benner plays the "we will propose KPMG to our shareholders BEOY", this can increase the trust in him significantly/KPMG (or other) to validate the 2026 IFRS accounts & having a word on HGB's: though still consolidated, at least we'll know...AEP being eventually acquired: while it carries a high integration risk due to its size, they talked about it so many times, that trust goes with it.Without this combination of event, the equity is doomed to stay at this level, IMO.Do not forget to also follow the bond: with TPG's announced safe harbor plan for buyback (25% of daily exchange), it is also interesting to check this illiquid and retail market: https://live.deutsche-boerse.com/bond/no0013256834-the-platform-group-ag-8-875-24-28?mic=XFRA
1
|0
CO

Constantin_Mar on Platform Group SE KGaA ·
Quite a lot of speculation presented as if it were evidence.You are combining alleged payment disputes, alleged bank actions, legal disputes with journalists and other unverified claims to imply that TPG’s financial reporting is somehow unreliable or that the company is approaching insolvency. That’s a very serious conclusion, but the evidence you’ve presented doesn’t establish it.TPG’s financial statements, share count, debt, cash flow and acquisitions can all be checked against official filings and corporate documents. That’s called due diligence. Repeating allegations and then pointing to a low P/E doesn’t prove anything.In fact, the P/E below 1 is precisely the reason the underlying numbers need to be investigated rather than dismissed. If you have documentary evidence that TPG’s reported figures are false, that banks actually cancelled the alleged facilities, or that the company is insolvent, publish the documents and numbers.Otherwise, this reads less like analysis and more like an attempt to create fear and selling pressure around a micro-cap stock.Claims require evidence. Allegations are not evidence.
1
|1
