
Advertisement
- Spain
- /
- Paper and Forestry Products
- /
- BME:IBG
Do You Know What Iberpapel Gestión, S.A.'s (BME:IBG) P/E Ratio Means?

This article is for investors who would like to improve their understanding of price to earnings ratios (P/E ratios). We'll show how you can use Iberpapel Gestión, S.A.'s (BME:IBG) P/E ratio to inform your assessment of the investment opportunity. Iberpapel Gestión has a P/E ratio of 10.16, based on the last twelve months. That corresponds to an earnings yield of approximately 9.8%.
Check out our latest analysis for Iberpapel Gestión
How Do I Calculate A Price To Earnings Ratio?
The formula for P/E is:
Price to Earnings Ratio = Share Price ÷ Earnings per Share (EPS)
Or for Iberpapel Gestión:
P/E of 10.16 = €20.900 ÷ €2.058 (Based on the trailing twelve months to March 2020.)
(Note: the above calculation results may not be precise due to rounding.)
Is A High Price-to-Earnings Ratio Good?
A higher P/E ratio means that buyers have to pay a higher price for each €1 the company has earned over the last year. That is not a good or a bad thing per se, but a high P/E does imply buyers are optimistic about the future.
How Does Iberpapel Gestión's P/E Ratio Compare To Its Peers?
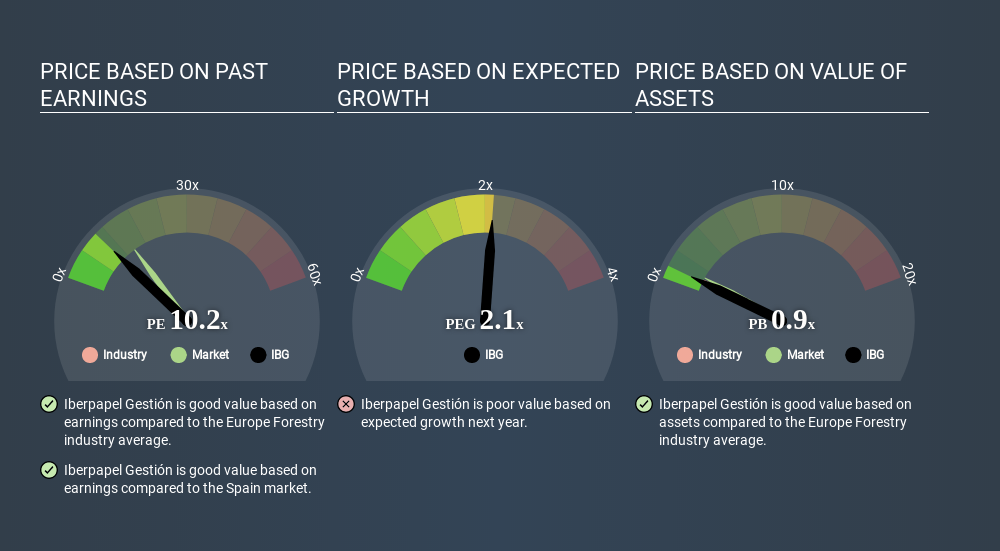
One good way to get a quick read on what market participants expect of a company is to look at its P/E ratio. The image below shows that Iberpapel Gestión has a P/E ratio that is roughly in line with the forestry industry average (10.2).
That indicates that the market expects Iberpapel Gestión will perform roughly in line with other companies in its industry. If the company has better than average prospects, then the market might be underestimating it. Checking factors such as director buying and selling. could help you form your own view on if that will happen.
How Growth Rates Impact P/E Ratios
P/E ratios primarily reflect market expectations around earnings growth rates. If earnings are growing quickly, then the 'E' in the equation will increase faster than it would otherwise. And in that case, the P/E ratio itself will drop rather quickly. And as that P/E ratio drops, the company will look cheap, unless its share price increases.
Iberpapel Gestión's earnings per share fell by 13% in the last twelve months.
A Limitation: P/E Ratios Ignore Debt and Cash In The Bank
The 'Price' in P/E reflects the market capitalization of the company. In other words, it does not consider any debt or cash that the company may have on the balance sheet. The exact same company would hypothetically deserve a higher P/E ratio if it had a strong balance sheet, than if it had a weak one with lots of debt, because a cashed up company can spend on growth.
Spending on growth might be good or bad a few years later, but the point is that the P/E ratio does not account for the option (or lack thereof).
Is Debt Impacting Iberpapel Gestión's P/E?
With net cash of €64m, Iberpapel Gestión has a very strong balance sheet, which may be important for its business. Having said that, at 28% of its market capitalization the cash hoard would contribute towards a higher P/E ratio.
The Bottom Line On Iberpapel Gestión's P/E Ratio
Iberpapel Gestión's P/E is 10.2 which is below average (14.5) in the ES market. The recent drop in earnings per share would almost certainly temper expectations, the relatively strong balance sheet will allow the company time to invest in growth. If it achieves that, then there's real potential that the low P/E could eventually indicate undervaluation.
When the market is wrong about a stock, it gives savvy investors an opportunity. If it is underestimating a company, investors can make money by buying and holding the shares until the market corrects itself. So this free report on the analyst consensus forecasts could help you make a master move on this stock.
But note: Iberpapel Gestión may not be the best stock to buy. So take a peek at this free list of interesting companies with strong recent earnings growth (and a P/E ratio below 20).
If you spot an error that warrants correction, please contact the editor at editorial-team@simplywallst.com. This article by Simply Wall St is general in nature. It does not constitute a recommendation to buy or sell any stock, and does not take account of your objectives, or your financial situation. Simply Wall St has no position in the stocks mentioned.
We aim to bring you long-term focused research analysis driven by fundamental data. Note that our analysis may not factor in the latest price-sensitive company announcements or qualitative material. Thank you for reading.
About BME:IBG
Iberpapel Gestión
Manufactures and markets printing and writing paper in Spain, rest of the European Union, South America, Africa, and internationally.
Flawless balance sheet average dividend payer.
Similar Companies
Market Insights

Advertisement
Community Narratives
Vita Life Sciences Set for a 12.72% Revenue Growth While Tackling Operational Challenges
Fair Value AU$2.42|8.7% undervalued
RO
Community Contributor
Vossloh rides a €500 billion wave to boost growth and earnings in the next decade
Fair Value €78.41|7.2% undervalued
CH
Community Contributor
Intuitive Surgical Will Transform Healthcare with 12% Revenue Growth
Fair Value US$325.55|56.5% overvalued
UN
Community Contributor