
Advertisement
- United States
- /
- Airlines
- /
- NasdaqGS:AAL
Do You Know About American Airlines Group Inc.’s (NASDAQ:AAL) ROCE?
Today we'll look at American Airlines Group Inc. (NASDAQ:AAL) and reflect on its potential as an investment. To be precise, we'll consider its Return On Capital Employed (ROCE), as that will inform our view of the quality of the business.
First up, we'll look at what ROCE is and how we calculate it. Then we'll compare its ROCE to similar companies. Then we'll determine how its current liabilities are affecting its ROCE.
Return On Capital Employed (ROCE): What is it?
ROCE measures the amount of pre-tax profits a company can generate from the capital employed in its business. Generally speaking a higher ROCE is better. Ultimately, it is a useful but imperfect metric. Author Edwin Whiting says to be careful when comparing the ROCE of different businesses, since 'No two businesses are exactly alike.
So, How Do We Calculate ROCE?
The formula for calculating the return on capital employed is:
Return on Capital Employed = Earnings Before Interest and Tax (EBIT) ÷ (Total Assets - Current Liabilities)
Or for American Airlines Group:
0.093 = US$3.9b ÷ (US$60b - US$18b) (Based on the trailing twelve months to December 2019.)
Therefore, American Airlines Group has an ROCE of 9.3%.
Check out our latest analysis for American Airlines Group
Is American Airlines Group's ROCE Good?
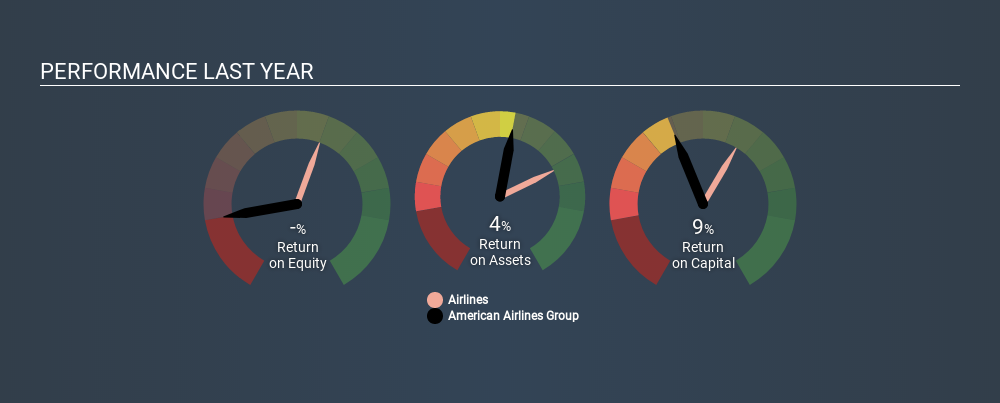
ROCE is commonly used for comparing the performance of similar businesses. Using our data, American Airlines Group's ROCE appears to be around the 12% average of the Airlines industry. Separate from how American Airlines Group stacks up against its industry, its ROCE in absolute terms is mediocre; relative to the returns on government bonds. It is possible that there are more rewarding investments out there.
American Airlines Group's current ROCE of 9.3% is lower than 3 years ago, when the company reported a 16% ROCE. Therefore we wonder if the company is facing new headwinds. You can see in the image below how American Airlines Group's ROCE compares to its industry. Click to see more on past growth.
When considering this metric, keep in mind that it is backwards looking, and not necessarily predictive. ROCE can be misleading for companies in cyclical industries, with returns looking impressive during the boom times, but very weak during the busts. ROCE is only a point-in-time measure. What happens in the future is pretty important for investors, so we have prepared a free report on analyst forecasts for American Airlines Group.
What Are Current Liabilities, And How Do They Affect American Airlines Group's ROCE?
Current liabilities include invoices, such as supplier payments, short-term debt, or a tax bill, that need to be paid within 12 months. The ROCE equation subtracts current liabilities from capital employed, so a company with a lot of current liabilities appears to have less capital employed, and a higher ROCE than otherwise. To check the impact of this, we calculate if a company has high current liabilities relative to its total assets.
American Airlines Group has total assets of US$60b and current liabilities of US$18b. Therefore its current liabilities are equivalent to approximately 31% of its total assets. American Airlines Group has a medium level of current liabilities, which would boost its ROCE somewhat.
The Bottom Line On American Airlines Group's ROCE
Despite this, its ROCE is still mediocre, and you may find more appealing investments elsewhere. But note: make sure you look for a great company, not just the first idea you come across. So take a peek at this free list of interesting companies with strong recent earnings growth (and a P/E ratio below 20).
If you are like me, then you will not want to miss this free list of growing companies that insiders are buying.
If you spot an error that warrants correction, please contact the editor at editorial-team@simplywallst.com. This article by Simply Wall St is general in nature. It does not constitute a recommendation to buy or sell any stock, and does not take account of your objectives, or your financial situation. Simply Wall St has no position in the stocks mentioned.
We aim to bring you long-term focused research analysis driven by fundamental data. Note that our analysis may not factor in the latest price-sensitive company announcements or qualitative material. Thank you for reading.
About NasdaqGS:AAL
American Airlines Group
Through its subsidiaries, operates as a network air carrier in the United States, Latin America, Atlantic, and Pacific.
Good value with reasonable growth potential.
Similar Companies
Market Insights


Advertisement
Community Narratives
Suncorp’s Next Chapter: Insurance-Only and Ready to Grow
Fair Value AU$22.83|5.7% undervalued
RO
Community Contributor
Thyssenkrupp Nucera Will Achieve Double-Digit Profits by 2030 Boosted by Hydrogen Growth
Fair Value €14.40|31.6% undervalued
CH
Community Contributor
Tesla’s Nvidia Moment – The AI & Robotics Inflection Point
Fair Value US$384.84|18.0% undervalued
BL
Community Contributor