
Advertisement
- United States
- /
- Software
- /
- NasdaqGS:INTU
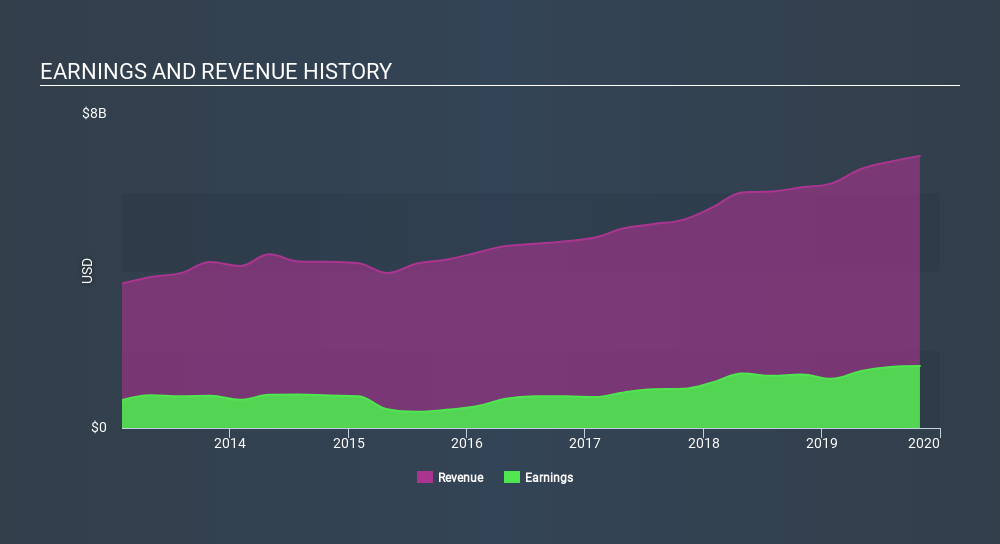
Did Intuit Inc.'s (NASDAQ:INTU) Recent Earnings Growth Beat The Trend?

Analyzing Intuit Inc.'s (NasdaqGS:INTU) track record of past performance is a valuable exercise for investors. It enables us to reflect on whether or not the company has met expectations, which is a powerful signal for future performance. Today I will assess INTU's recent performance announced on 31 October 2019 and compare these figures to its long-term trend and industry movements.
View our latest analysis for Intuit
Could INTU beat the long-term trend and outperform its industry?
INTU's trailing twelve-month earnings (from 31 October 2019) of US$1.6b has jumped 16% compared to the previous year.
However, this one-year growth rate has been lower than its average earnings growth rate over the past 5 years of 22%, indicating the rate at which INTU is growing has slowed down. Why could this be happening? Well, let’s take a look at what’s occurring with margins and whether the whole industry is feeling the heat.
In terms of returns from investment, Intuit has invested its equity funds well leading to a 43% return on equity (ROE), above the sensible minimum of 20%. Furthermore, its return on assets (ROA) of 25% exceeds the US Software industry of 6.7%, indicating Intuit has used its assets more efficiently. However, its return on capital (ROC), which also accounts for Intuit’s debt level, has declined over the past 3 years from 69% to 42%.
What does this mean?
Though Intuit's past data is helpful, it is only one aspect of my investment thesis. Positive growth and profitability are what investors like to see in a company’s track record, but how do we properly assess sustainability? I recommend you continue to research Intuit to get a better picture of the stock by looking at:
- Future Outlook: What are well-informed industry analysts predicting for INTU’s future growth? Take a look at our free research report of analyst consensus for INTU’s outlook.
- Financial Health: Are INTU’s operations financially sustainable? Balance sheets can be hard to analyze, which is why we’ve done it for you. Check out our financial health checks here.
- Other High-Performing Stocks: Are there other stocks that provide better prospects with proven track records? Explore our free list of these great stocks here.
NB: Figures in this article are calculated using data from the trailing twelve months from 31 October 2019. This may not be consistent with full year annual report figures.
If you spot an error that warrants correction, please contact the editor at editorial-team@simplywallst.com. This article by Simply Wall St is general in nature. It does not constitute a recommendation to buy or sell any stock, and does not take account of your objectives, or your financial situation. Simply Wall St has no position in the stocks mentioned.
We aim to bring you long-term focused research analysis driven by fundamental data. Note that our analysis may not factor in the latest price-sensitive company announcements or qualitative material. Thank you for reading.
About NasdaqGS:INTU
Intuit
Provides financial management, compliance, and marketing products and services in the United States.
Excellent balance sheet with reasonable growth potential.
Similar Companies
Market Insights

Advertisement
Community Narratives
WhiteCap Is Positioned To Profit Regardless Of Trump's Policy 
Fair Value CA$22.60|61.5% undervalued
ST
Equity Analyst and Writer
Microsoft's Evolution Will Drive Revenue to New Heights Fueled by AI
Fair Value US$360.00|30.7% overvalued
BR
Community Contributor
A CASE FOR USD$2.50 (CAD$3.44) BY 2028 (A 5-10 BAGGER)
Fair Value CA$3.44|88.1% undervalued
AG
Community Contributor