Advertisement
Did Changing Sentiment Drive Jensen-Group's (EBR:JEN) Share Price Down By 46%?
In order to justify the effort of selecting individual stocks, it's worth striving to beat the returns from a market index fund. But in any portfolio, there are likely to be some stocks that fall short of that benchmark. Unfortunately, that's been the case for longer term Jensen-Group NV (EBR:JEN) shareholders, since the share price is down 46% in the last three years, falling well short of the market decline of around 25%. And the ride hasn't got any smoother in recent times over the last year, with the price 32% lower in that time. In contrast, the stock price has popped 9.7% in the last thirty days. But this could be related to good market conditions, with stocks up around 12% during the period.
See our latest analysis for Jensen-Group
While markets are a powerful pricing mechanism, share prices reflect investor sentiment, not just underlying business performance. By comparing earnings per share (EPS) and share price changes over time, we can get a feel for how investor attitudes to a company have morphed over time.
Jensen-Group saw its EPS decline at a compound rate of 3.0% per year, over the last three years. The share price decline of 19% is actually steeper than the EPS slippage. So it seems the market was too confident about the business, in the past. The less favorable sentiment is reflected in its current P/E ratio of 11.16.
You can see below how EPS has changed over time (discover the exact values by clicking on the image).
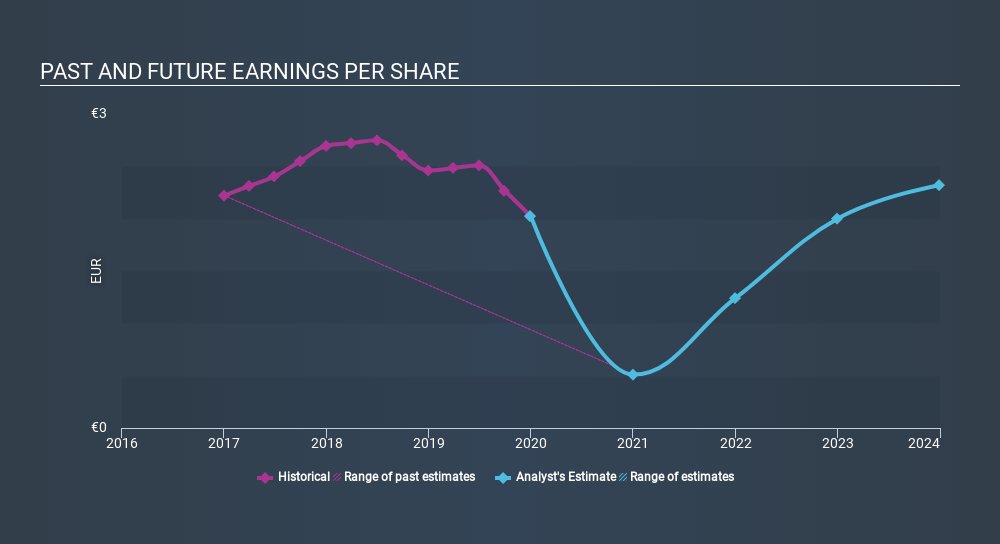
It might be well worthwhile taking a look at our free report on Jensen-Group's earnings, revenue and cash flow.
What About Dividends?
As well as measuring the share price return, investors should also consider the total shareholder return (TSR). The TSR incorporates the value of any spin-offs or discounted capital raisings, along with any dividends, based on the assumption that the dividends are reinvested. Arguably, the TSR gives a more comprehensive picture of the return generated by a stock. As it happens, Jensen-Group's TSR for the last 3 years was -44%, which exceeds the share price return mentioned earlier. This is largely a result of its dividend payments!
A Different Perspective
While the broader market lost about 19% in the twelve months, Jensen-Group shareholders did even worse, losing 32% (even including dividends) . However, it could simply be that the share price has been impacted by broader market jitters. It might be worth keeping an eye on the fundamentals, in case there's a good opportunity. Longer term investors wouldn't be so upset, since they would have made 3.6%, each year, over five years. It could be that the recent sell-off is an opportunity, so it may be worth checking the fundamental data for signs of a long term growth trend. Before forming an opinion on Jensen-Group you might want to consider the cold hard cash it pays as a dividend. This free chart tracks its dividend over time.
Of course, you might find a fantastic investment by looking elsewhere. So take a peek at this free list of companies we expect will grow earnings.
Please note, the market returns quoted in this article reflect the market weighted average returns of stocks that currently trade on BE exchanges.
Love or hate this article? Concerned about the content? Get in touch with us directly. Alternatively, email editorial-team@simplywallst.com.
This article by Simply Wall St is general in nature. It does not constitute a recommendation to buy or sell any stock, and does not take account of your objectives, or your financial situation. We aim to bring you long-term focused analysis driven by fundamental data. Note that our analysis may not factor in the latest price-sensitive company announcements or qualitative material. Simply Wall St has no position in any stocks mentioned. Thank you for reading.
About ENXTBR:JEN
Jensen-Group
Designs, produces, and supplies single machines, systems, turnkey solutions, and laundry process automation for the heavy-duty laundry industry.
Flawless balance sheet and undervalued.
Market Insights


Advertisement
Weekly Picks
LO


Lou_Basenese on Cue Biopharma ·
Cue Biopharma (NASDAQ: CUE): The Scientist Behind Xolair Just Gave Cue a Next-Generation Shot at the Same Multi-Billion-Dollar Market
Fair Value:US$7061.6% undervalued
6 followersusers have followed this narrative
0 commentsusers have commented on this narrative
3 likesusers have liked this narrative
HE


HedgeY on AST SpaceMobile ·
AST SpaceMobile: The Boldest Direct-to-Cell Bet in Public Markets
Fair Value:US$17036.6% undervalued
25 followersusers have followed this narrative
0 commentsusers have commented on this narrative
9 likesusers have liked this narrative
FU

FundamentalFlow on Onto Innovation ·
Onto Innovation: The Advanced Packaging Chokepoint 51.3% undervalued intrinsic discount
Fair Value:US$38026.3% undervalued
17 followersusers have followed this narrative
0 commentsusers have commented on this narrative
6 likesusers have liked this narrative
MA


martinarauz on Nu Holdings ·
Investment Analysis (May 2026)
Fair Value:US$22.7448.8% undervalued
45 followersusers have followed this narrative
0 commentsusers have commented on this narrative
12 likesusers have liked this narrative
Recently Updated Narratives
IM

Imthetxarbi on Maha Capital ·
Is It worth SEK 16? Arbitrage opportunity?
Fair Value:SEK 0.681.1k% overvalued
6 followersusers have followed this narrative
0 commentsusers have commented on this narrative
0 likesusers have liked this narrative
AR

ariz_scribe on Marti Technologies ·
$MRT at Roth - Pick of the Panel
Fair Value:US$1.968.7% undervalued
4 followersusers have followed this narrative
0 commentsusers have commented on this narrative
0 likesusers have liked this narrative
CJ

cjimi on Wise Group ·
Wise: A Quality Cross-Border Payments Compounder, But Not A Bargain
Fair Value:UK£12.0232.6% undervalued
1 followerusers have followed this narrative
0 commentsusers have commented on this narrative
0 likesusers have liked this narrative
Popular Narratives
GO

GoldenSands on QuantumScape ·
QuantumScape: A Mispriced Deep‑Tech Inflection Point With Multi‑Billion‑Dollar Optionality
Fair Value:US$8589.7% undervalued
124 followersusers have followed this narrative
2 commentsusers have commented on this narrative
36 likesusers have liked this narrative
CL


Clive_Thompson on Take-Two Interactive Software ·
Take-Two Interactive: The Calm Before the Storm NASDAQ: TTWO Last Price: $242.41 Date: May 15, 2026
Fair Value:US$276.9722.1% undervalued
56 followersusers have followed this narrative
0 commentsusers have commented on this narrative
14 likesusers have liked this narrative
NI


niteco on Honeywell International ·
Honeywell - The Demand-Side of the AI Infrastructure
Fair Value:US$320.1930.3% undervalued
46 followersusers have followed this narrative
0 commentsusers have commented on this narrative
19 likesusers have liked this narrative


