Advertisement
- Canada
- /
- Metals and Mining
- /
- TSX:SSRM
Despite Its High P/E Ratio, Is SSR Mining Inc. (TSE:SSRM) Still Undervalued?
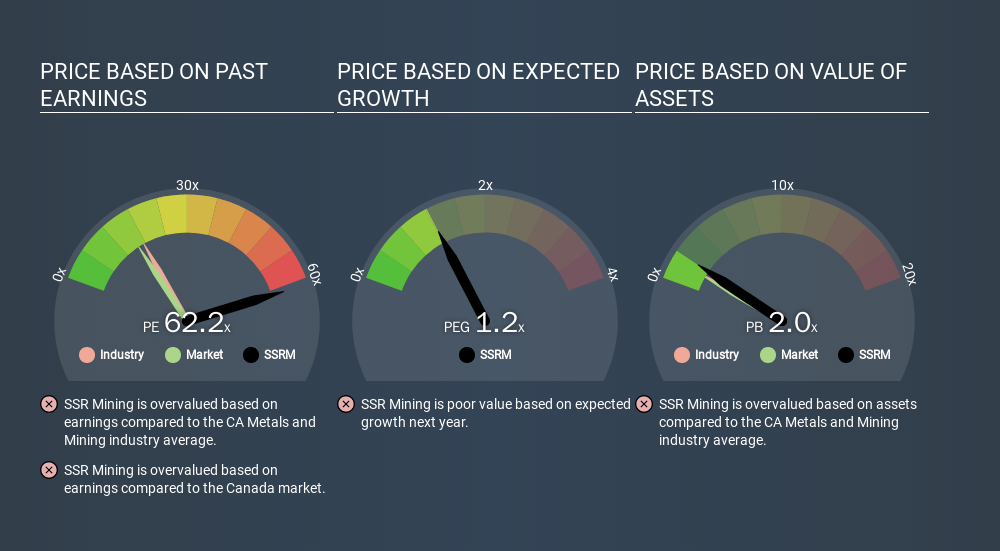
The goal of this article is to teach you how to use price to earnings ratios (P/E ratios). We'll show how you can use SSR Mining Inc.'s (TSE:SSRM) P/E ratio to inform your assessment of the investment opportunity. SSR Mining has a price to earnings ratio of 62.20, based on the last twelve months. That corresponds to an earnings yield of approximately 1.6%.
See our latest analysis for SSR Mining
How Do I Calculate A Price To Earnings Ratio?
The formula for P/E is:
Price to Earnings Ratio = Price per Share (in the reporting currency) ÷ Earnings per Share (EPS)
Or for SSR Mining:
P/E of 62.20 = USD17.64 (Note: this is the share price in the reporting currency, namely, USD ) ÷ USD0.28 (Based on the trailing twelve months to September 2019.)
Is A High Price-to-Earnings Ratio Good?
The higher the P/E ratio, the higher the price tag of a business, relative to its trailing earnings. All else being equal, it's better to pay a low price -- but as Warren Buffett said, 'It's far better to buy a wonderful company at a fair price than a fair company at a wonderful price'.
How Does SSR Mining's P/E Ratio Compare To Its Peers?
The P/E ratio indicates whether the market has higher or lower expectations of a company. You can see in the image below that the average P/E (16.3) for companies in the metals and mining industry is a lot lower than SSR Mining's P/E.
That means that the market expects SSR Mining will outperform other companies in its industry. Shareholders are clearly optimistic, but the future is always uncertain. So further research is always essential. I often monitor director buying and selling.
How Growth Rates Impact P/E Ratios
Probably the most important factor in determining what P/E a company trades on is the earnings growth. If earnings are growing quickly, then the 'E' in the equation will increase faster than it would otherwise. That means even if the current P/E is high, it will reduce over time if the share price stays flat. A lower P/E should indicate the stock is cheap relative to others -- and that may attract buyers.
Notably, SSR Mining grew EPS by a whopping 32% in the last year.
Don't Forget: The P/E Does Not Account For Debt or Bank Deposits
One drawback of using a P/E ratio is that it considers market capitalization, but not the balance sheet. So it won't reflect the advantage of cash, or disadvantage of debt. Hypothetically, a company could reduce its future P/E ratio by spending its cash (or taking on debt) to achieve higher earnings.
Such spending might be good or bad, overall, but the key point here is that you need to look at debt to understand the P/E ratio in context.
Is Debt Impacting SSR Mining's P/E?
With net cash of US$245m, SSR Mining has a very strong balance sheet, which may be important for its business. Having said that, at 11% of its market capitalization the cash hoard would contribute towards a higher P/E ratio.
The Bottom Line On SSR Mining's P/E Ratio
With a P/E ratio of 62.2, SSR Mining is expected to grow earnings very strongly in the years to come. The excess cash it carries is the gravy on top its fast EPS growth. To us, this is the sort of company that we would expect to carry an above average price tag (relative to earnings).
Investors have an opportunity when market expectations about a stock are wrong. If the reality for a company is better than it expects, you can make money by buying and holding for the long term. So this free visualization of the analyst consensus on future earnings could help you make the right decision about whether to buy, sell, or hold.
Of course you might be able to find a better stock than SSR Mining. So you may wish to see this free collection of other companies that have grown earnings strongly.
If you spot an error that warrants correction, please contact the editor at editorial-team@simplywallst.com. This article by Simply Wall St is general in nature. It does not constitute a recommendation to buy or sell any stock, and does not take account of your objectives, or your financial situation. Simply Wall St has no position in the stocks mentioned.
We aim to bring you long-term focused research analysis driven by fundamental data. Note that our analysis may not factor in the latest price-sensitive company announcements or qualitative material. Thank you for reading.
About TSX:SSRM
SSR Mining
Engages in the acquisition, exploration, and development of precious metal resource properties in the United States, Türkiye, Canada, and Argentina.
Very undervalued with flawless balance sheet.
Similar Companies
Market Insights


Advertisement
Weekly Picks
CE


Ceazar on Eva Live ·
This small cap is building the AI workforce of the future
Fair Value:US$7.4352.0% undervalued
75 followersusers have followed this narrative
0 commentsusers have commented on this narrative
16 likesusers have liked this narrative
TR


tripledub on lululemon athletica ·
Lululemon Got Boring Right About the Time It Got Cheap. That's Usually the Point
Fair Value:US$22042.4% undervalued
25 followersusers have followed this narrative
6 commentsusers have commented on this narrative
26 likesusers have liked this narrative
WO


woodworthfund on Kraft Heinz ·
Kraft Heinz (KHC): Less Drama, More Ketchup
Fair Value:US$3532.7% undervalued
8 followersusers have followed this narrative
0 commentsusers have commented on this narrative
2 likesusers have liked this narrative
CA


Canderous on PetroTal ·
Beyond 2026, Beyond a Double
Fair Value:CA$1.8168.5% undervalued
27 followersusers have followed this narrative
0 commentsusers have commented on this narrative
3 likesusers have liked this narrative
Recently Updated Narratives
DE


DeathSmiIes on New Horizon Aircraft ·
HORIZON AIRCRAFT (HOVR) Institutional Investor Package August 1, 2025 — Confidential Review Draft
Fair Value:US$2087.6% undervalued
5 followersusers have followed this narrative
0 commentsusers have commented on this narrative
0 likesusers have liked this narrative
CO


Coward_Nutlick on Elicio Therapeutics ·
Very Bullish
Fair Value:US$10090.1% undervalued
20 followersusers have followed this narrative
3 commentsusers have commented on this narrative
2 likesusers have liked this narrative
KA


kapirey on KKR ·
Incluso con un colapso brutal del crédito KKR mantendría beneficios relevantes
Fair Value:US$84.4512.2% overvalued
1 followerusers have followed this narrative
0 commentsusers have commented on this narrative
0 likesusers have liked this narrative
Popular Narratives
GO

GoldenSands on QuantumScape ·
QuantumScape: A Mispriced Deep‑Tech Inflection Point With Multi‑Billion‑Dollar Optionality
Fair Value:US$8590.1% undervalued
114 followersusers have followed this narrative
2 commentsusers have commented on this narrative
31 likesusers have liked this narrative
AN


AnalystConsensusTarget on NVIDIA ·
NVDA: Expanding AI Demand Will Drive Major Data Center Investments Through 2026
Fair Value:US$268.6118.3% undervalued
1193 followersusers have followed this narrative
7 commentsusers have commented on this narrative
34 likesusers have liked this narrative
TR
tripledub on lululemon athletica ·
Lululemon Got Boring Right About the Time It Got Cheap. That's Usually the Point
Fair Value:US$22042.4% undervalued
25 followersusers have followed this narrative
6 commentsusers have commented on this narrative
26 likesusers have liked this narrative