
Advertisement
- United States
- /
- Luxury
- /
- NYSE:RL
Despite Its High P/E Ratio, Is Ralph Lauren Corporation (NYSE:RL) Still Undervalued?

The goal of this article is to teach you how to use price to earnings ratios (P/E ratios). We'll look at Ralph Lauren Corporation's (NYSE:RL) P/E ratio and reflect on what it tells us about the company's share price. Ralph Lauren has a price to earnings ratio of 19.67, based on the last twelve months. That corresponds to an earnings yield of approximately 5.1%.
View our latest analysis for Ralph Lauren
How Do I Calculate A Price To Earnings Ratio?
The formula for P/E is:
Price to Earnings Ratio = Share Price ÷ Earnings per Share (EPS)
Or for Ralph Lauren:
P/E of 19.67 = USD112.96 ÷ USD5.74 (Based on the trailing twelve months to September 2019.)
Is A High Price-to-Earnings Ratio Good?
A higher P/E ratio implies that investors pay a higher price for the earning power of the business. That is not a good or a bad thing per se, but a high P/E does imply buyers are optimistic about the future.
How Does Ralph Lauren's P/E Ratio Compare To Its Peers?
The P/E ratio essentially measures market expectations of a company. The image below shows that Ralph Lauren has a higher P/E than the average (18.2) P/E for companies in the luxury industry.
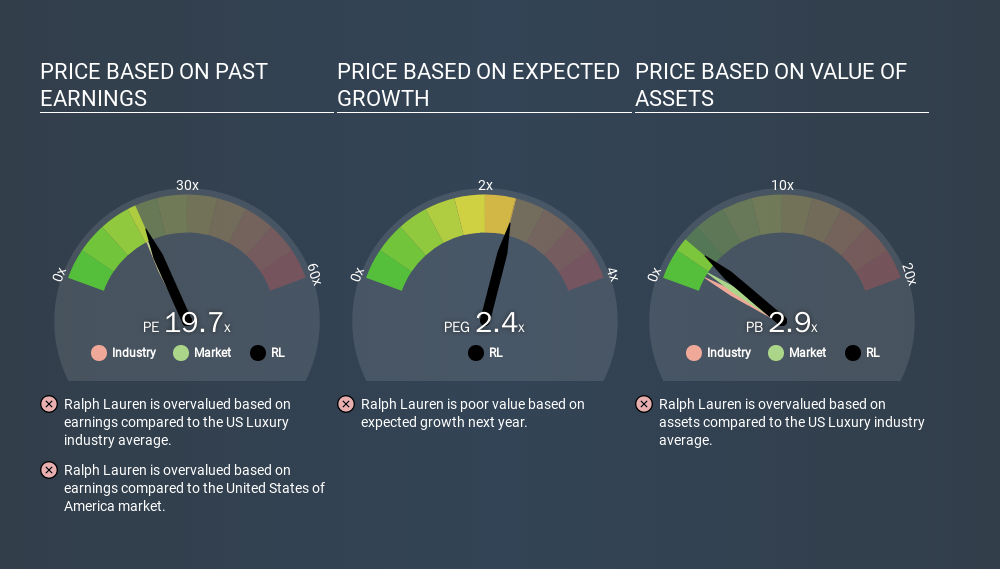
Ralph Lauren's P/E tells us that market participants think the company will perform better than its industry peers, going forward. Clearly the market expects growth, but it isn't guaranteed. So further research is always essential. I often monitor director buying and selling.
How Growth Rates Impact P/E Ratios
Earnings growth rates have a big influence on P/E ratios. That's because companies that grow earnings per share quickly will rapidly increase the 'E' in the equation. And in that case, the P/E ratio itself will drop rather quickly. So while a stock may look expensive based on past earnings, it could be cheap based on future earnings.
In the last year, Ralph Lauren grew EPS like Taylor Swift grew her fan base back in 2010; the 97% gain was both fast and well deserved. And earnings per share have improved by 35% annually, over the last three years. So we'd absolutely expect it to have a relatively high P/E ratio. Unfortunately, earnings per share are down 7.3% a year, over 5 years.
A Limitation: P/E Ratios Ignore Debt and Cash In The Bank
Don't forget that the P/E ratio considers market capitalization. That means it doesn't take debt or cash into account. Theoretically, a business can improve its earnings (and produce a lower P/E in the future) by investing in growth. That means taking on debt (or spending its cash).
Spending on growth might be good or bad a few years later, but the point is that the P/E ratio does not account for the option (or lack thereof).
Is Debt Impacting Ralph Lauren's P/E?
Ralph Lauren has net cash of US$894m. This is fairly high at 11% of its market capitalization. That might mean balance sheet strength is important to the business, but should also help push the P/E a bit higher than it would otherwise be.
The Verdict On Ralph Lauren's P/E Ratio
Ralph Lauren's P/E is 19.7 which is about average (18.3) in the US market. The excess cash it carries is the gravy on top its fast EPS growth. So at a glance we're a bit surprised that Ralph Lauren does not have a higher P/E ratio. Because analysts are even expecting further profit growth, we would venture this stock is worth a closer look..
Investors should be looking to buy stocks that the market is wrong about. If the reality for a company is better than it expects, you can make money by buying and holding for the long term. So this free visual report on analyst forecasts could hold the key to an excellent investment decision.
You might be able to find a better buy than Ralph Lauren. If you want a selection of possible winners, check out this free list of interesting companies that trade on a P/E below 20 (but have proven they can grow earnings).
If you spot an error that warrants correction, please contact the editor at editorial-team@simplywallst.com. This article by Simply Wall St is general in nature. It does not constitute a recommendation to buy or sell any stock, and does not take account of your objectives, or your financial situation. Simply Wall St has no position in the stocks mentioned.
We aim to bring you long-term focused research analysis driven by fundamental data. Note that our analysis may not factor in the latest price-sensitive company announcements or qualitative material. Thank you for reading.
About NYSE:RL
Ralph Lauren
Designs, markets, and distributes lifestyle products in North America, Europe, Asia, and internationally.
Solid track record with excellent balance sheet.
Similar Companies
Market Insights


Advertisement
Community Narratives
The Future of Drug Testing? Fingerprint Tech Shows Serious Promise
Fair Value US$2.98|38.6% undervalued
JO
Community Contributor
Suncorp’s Next Chapter: Insurance-Only and Ready to Grow
Fair Value AU$22.83|8.8% undervalued
RO
Community Contributor
Thyssenkrupp Nucera Will Achieve Double-Digit Profits by 2030 Boosted by Hydrogen Growth
Fair Value €14.40|31.6% undervalued
CH
Community Contributor
Tesla’s Nvidia Moment – The AI & Robotics Inflection Point
Fair Value US$384.84|18.0% undervalued
BL
Community Contributor