
Advertisement
- Singapore
- /
- Real Estate
- /
- SGX:OYY
Despite Its High P/E Ratio, Is PropNex Limited (SGX:OYY) Still Undervalued?

This article is for investors who would like to improve their understanding of price to earnings ratios (P/E ratios). We'll apply a basic P/E ratio analysis to PropNex Limited's (SGX:OYY), to help you decide if the stock is worth further research. PropNex has a price to earnings ratio of 12.56, based on the last twelve months. In other words, at today's prices, investors are paying SGD12.56 for every SGD1 in prior year profit.
View our latest analysis for PropNex
How Do I Calculate A Price To Earnings Ratio?
The formula for P/E is:
Price to Earnings Ratio = Share Price ÷ Earnings per Share (EPS)
Or for PropNex:
P/E of 12.56 = SGD0.50 ÷ SGD0.040 (Based on the year to June 2019.)
Is A High Price-to-Earnings Ratio Good?
A higher P/E ratio implies that investors pay a higher price for the earning power of the business. All else being equal, it's better to pay a low price -- but as Warren Buffett said, 'It's far better to buy a wonderful company at a fair price than a fair company at a wonderful price.'
How Does PropNex's P/E Ratio Compare To Its Peers?
One good way to get a quick read on what market participants expect of a company is to look at its P/E ratio. You can see in the image below that the average P/E (8.4) for companies in the real estate industry is lower than PropNex's P/E.
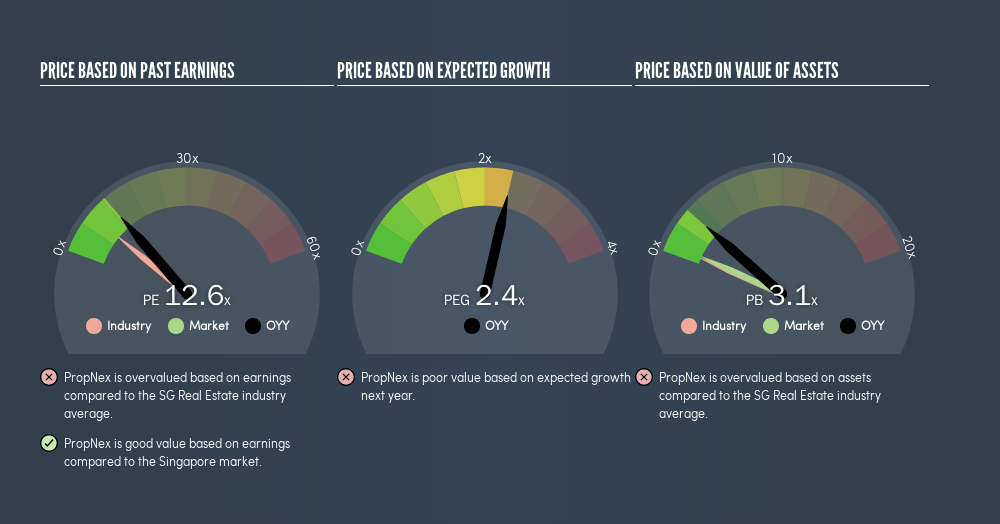
That means that the market expects PropNex will outperform other companies in its industry.
How Growth Rates Impact P/E Ratios
Generally speaking the rate of earnings growth has a profound impact on a company's P/E multiple. That's because companies that grow earnings per share quickly will rapidly increase the 'E' in the equation. And in that case, the P/E ratio itself will drop rather quickly. So while a stock may look expensive based on past earnings, it could be cheap based on future earnings.
PropNex saw earnings per share decrease by 44% last year. But it has grown its earnings per share by 13% per year over the last five years.
Remember: P/E Ratios Don't Consider The Balance Sheet
Don't forget that the P/E ratio considers market capitalization. Thus, the metric does not reflect cash or debt held by the company. The exact same company would hypothetically deserve a higher P/E ratio if it had a strong balance sheet, than if it had a weak one with lots of debt, because a cashed up company can spend on growth.
While growth expenditure doesn't always pay off, the point is that it is a good option to have; but one that the P/E ratio ignores.
So What Does PropNex's Balance Sheet Tell Us?
PropNex has net cash of S$73m. This is fairly high at 40% of its market capitalization. That might mean balance sheet strength is important to the business, but should also help push the P/E a bit higher than it would otherwise be.
The Bottom Line On PropNex's P/E Ratio
PropNex trades on a P/E ratio of 12.6, which is fairly close to the SG market average of 12.9. While the absence of growth in the last year is probably causing a degree of pessimism, the net cash position means it's not surprising that expectations put the company roughly in line with the market average P/E.
When the market is wrong about a stock, it gives savvy investors an opportunity. If the reality for a company is not as bad as the P/E ratio indicates, then the share price should increase as the market realizes this. So this free visualization of the analyst consensus on future earnings could help you make the right decision about whether to buy, sell, or hold.
Of course, you might find a fantastic investment by looking at a few good candidates. So take a peek at this free list of companies with modest (or no) debt, trading on a P/E below 20.
We aim to bring you long-term focused research analysis driven by fundamental data. Note that our analysis may not factor in the latest price-sensitive company announcements or qualitative material.
If you spot an error that warrants correction, please contact the editor at editorial-team@simplywallst.com. This article by Simply Wall St is general in nature. It does not constitute a recommendation to buy or sell any stock, and does not take account of your objectives, or your financial situation. Simply Wall St has no position in the stocks mentioned. Thank you for reading.
About SGX:OYY
PropNex
An investment holding company, provides real estate services in Singapore.
Flawless balance sheet with reasonable growth potential.
Market Insights


Advertisement
Community Narratives
The Future of Drug Testing? Fingerprint Tech Shows Serious Promise
Fair Value US$2.98|40.3% undervalued
JO
Community Contributor
Suncorp’s Next Chapter: Insurance-Only and Ready to Grow
Fair Value AU$22.83|7.9% undervalued
RO
Community Contributor
Thyssenkrupp Nucera Will Achieve Double-Digit Profits by 2030 Boosted by Hydrogen Growth
Fair Value €14.40|31.6% undervalued
CH
Community Contributor
Tesla’s Nvidia Moment – The AI & Robotics Inflection Point
Fair Value US$359.72|12.3% undervalued
BL
Community Contributor