Clariant Chemicals (India) (NSE:CLNINDIA) Has Returned Negative 23% To Its Shareholders In The Past Five Years


Clariant Chemicals (India) Limited (NSE:CLNINDIA) shareholders will doubtless be very grateful to see the share price up 32% in the last quarter. But if you look at the last five years the returns have not been good. In fact, the share price is down 47%, which falls well short of the return you could get by buying an index fund.
Check out our latest analysis for Clariant Chemicals (India)
In his essay The Superinvestors of Graham-and-Doddsville Warren Buffett described how share prices do not always rationally reflect the value of a business. By comparing earnings per share (EPS) and share price changes over time, we can get a feel for how investor attitudes to a company have morphed over time.
During the five years over which the share price declined, Clariant Chemicals (India)'s earnings per share (EPS) dropped by 53% each year. The share price decline of 12% per year isn't as bad as the EPS decline. The relatively muted share price reaction might be because the market expects the business to turn around. With a P/E ratio of 52.11, it's fair to say the market sees a brighter future for the business.
The graphic below depicts how EPS has changed over time (unveil the exact values by clicking on the image).
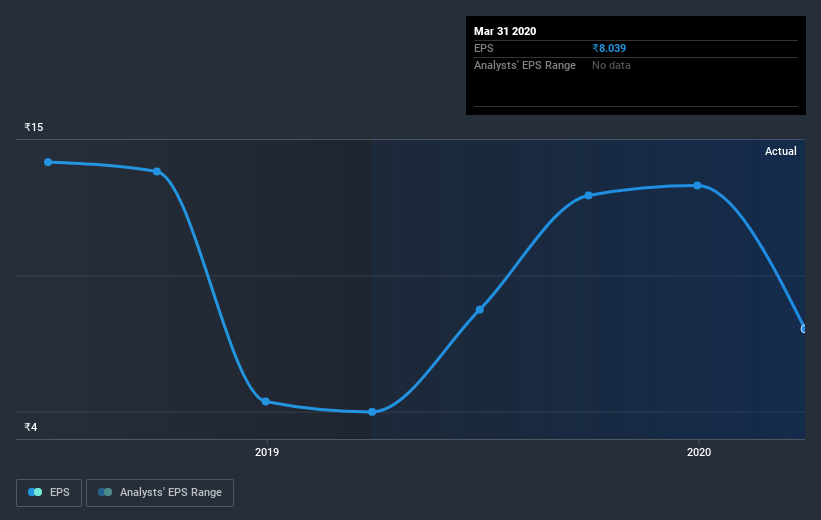
It might be well worthwhile taking a look at our free report on Clariant Chemicals (India)'s earnings, revenue and cash flow.
What About Dividends?
It is important to consider the total shareholder return, as well as the share price return, for any given stock. Whereas the share price return only reflects the change in the share price, the TSR includes the value of dividends (assuming they were reinvested) and the benefit of any discounted capital raising or spin-off. Arguably, the TSR gives a more comprehensive picture of the return generated by a stock. In the case of Clariant Chemicals (India), it has a TSR of -23% for the last 5 years. That exceeds its share price return that we previously mentioned. And there's no prize for guessing that the dividend payments largely explain the divergence!
A Different Perspective
We're pleased to report that Clariant Chemicals (India) shareholders have received a total shareholder return of 79% over one year. And that does include the dividend. That certainly beats the loss of about 4.3% per year over the last half decade. We generally put more weight on the long term performance over the short term, but the recent improvement could hint at a (positive) inflection point within the business. I find it very interesting to look at share price over the long term as a proxy for business performance. But to truly gain insight, we need to consider other information, too. Consider for instance, the ever-present spectre of investment risk. We've identified 3 warning signs with Clariant Chemicals (India) (at least 1 which is a bit unpleasant) , and understanding them should be part of your investment process.
If you like to buy stocks alongside management, then you might just love this free list of companies. (Hint: insiders have been buying them).
Please note, the market returns quoted in this article reflect the market weighted average returns of stocks that currently trade on IN exchanges.
When trading Clariant Chemicals (India) or any other investment, use the platform considered by many to be the Professional's Gateway to the Worlds Market, Interactive Brokers. You get the lowest-cost* trading on stocks, options, futures, forex, bonds and funds worldwide from a single integrated account. Promoted
Valuation is complex, but we're here to simplify it.
Discover if Heubach Colorants India might be undervalued or overvalued with our detailed analysis, featuring fair value estimates, potential risks, dividends, insider trades, and its financial condition.
Access Free AnalysisThis article by Simply Wall St is general in nature. It does not constitute a recommendation to buy or sell any stock, and does not take account of your objectives, or your financial situation. We aim to bring you long-term focused analysis driven by fundamental data. Note that our analysis may not factor in the latest price-sensitive company announcements or qualitative material. Simply Wall St has no position in any stocks mentioned.
*Interactive Brokers Rated Lowest Cost Broker by StockBrokers.com Annual Online Review 2020
Have feedback on this article? Concerned about the content? Get in touch with us directly. Alternatively, email editorial-team@simplywallst.com.
About NSEI:HEUBACHIND
Heubach Colorants India
Engages in the manufacture and sale of specialty chemicals in India and internationally.
Flawless balance sheet and fair value.

