
Advertisement

Howard Marks put it nicely when he said that, rather than worrying about share price volatility, 'The possibility of permanent loss is the risk I worry about... and every practical investor I know worries about.' It's only natural to consider a company's balance sheet when you examine how risky it is, since debt is often involved when a business collapses. As with many other companies China Futex Holdings Limited (HKG:8506) makes use of debt. But the real question is whether this debt is making the company risky.
What Risk Does Debt Bring?
Generally speaking, debt only becomes a real problem when a company can't easily pay it off, either by raising capital or with its own cash flow. In the worst case scenario, a company can go bankrupt if it cannot pay its creditors. However, a more common (but still painful) scenario is that it has to raise new equity capital at a low price, thus permanently diluting shareholders. By replacing dilution, though, debt can be an extremely good tool for businesses that need capital to invest in growth at high rates of return. The first thing to do when considering how much debt a business uses is to look at its cash and debt together.
See our latest analysis for China Futex Holdings
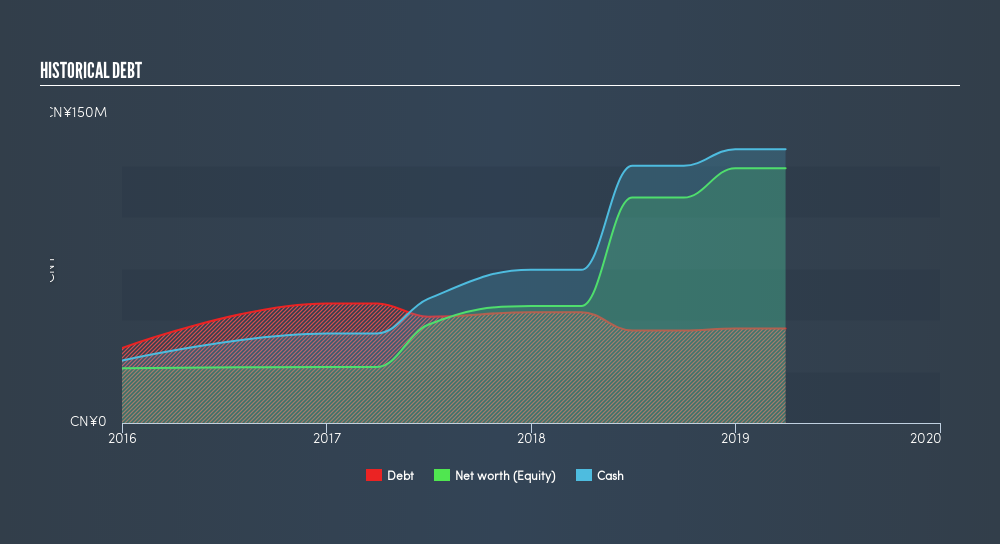
How Much Debt Does China Futex Holdings Carry?
You can click the graphic below for the historical numbers, but it shows that China Futex Holdings had CN¥45.9m of debt in December 2018, down from CN¥53.8m, one year before. However, it does have CN¥132.9m in cash offsetting this, leading to net cash of CN¥87.0m.
How Healthy Is China Futex Holdings's Balance Sheet?
Zooming in on the latest balance sheet data, we can see that China Futex Holdings had liabilities of CN¥78.1m due within 12 months and no liabilities due beyond that. On the other hand, it had cash of CN¥132.9m and CN¥29.7m worth of receivables due within a year. So it can boast CN¥84.6m more liquid assets than total liabilities.
This surplus liquidity suggests that China Futex Holdings's balance sheet could take a hit just as well as Homer Simpson's head can take a punch. With this in mind one could posit that its balance sheet is as strong as beautiful a rare rhino. Succinctly put, China Futex Holdings boasts net cash, so it's fair to say it does not have a heavy debt load!
On the other hand, China Futex Holdings saw its EBIT drop by 4.9% in the last twelve months. That sort of decline, if sustained, will obviously make debt harder to handle. When analysing debt levels, the balance sheet is the obvious place to start. But you can't view debt in total isolation; since China Futex Holdings will need earnings to service that debt. So when considering debt, it's definitely worth looking at the earnings trend. Click here for an interactive snapshot.
Finally, a business needs free cash flow to pay off debt; accounting profits just don't cut it. While China Futex Holdings has net cash on its balance sheet, it's still worth taking a look at its ability to convert earnings before interest and tax (EBIT) to free cash flow, to help us understand how quickly it is building (or eroding) that cash balance. Over the most recent three years, China Futex Holdings recorded free cash flow worth 56% of its EBIT, which is around normal, given free cash flow excludes interest and tax. This free cash flow puts the company in a good position to pay down debt, when appropriate.
Summing up
While it is always sensible to investigate a company's debt, in this case China Futex Holdings has CN¥87m in net cash and a decent-looking balance sheet. So is China Futex Holdings's debt a risk? It doesn't seem so to us. Above most other metrics, we think its important to track how fast earnings per share is growing, if at all. If you've also come to that realization, you're in luck, because today you can view this interactive graph of China Futex Holdings's earnings per share history for free.
If, after all that, you're more interested in a fast growing company with a rock-solid balance sheet, then check out our list of net cash growth stocks without delay.
We aim to bring you long-term focused research analysis driven by fundamental data. Note that our analysis may not factor in the latest price-sensitive company announcements or qualitative material.
If you spot an error that warrants correction, please contact the editor at editorial-team@simplywallst.com. This article by Simply Wall St is general in nature. It does not constitute a recommendation to buy or sell any stock, and does not take account of your objectives, or your financial situation. Simply Wall St has no position in the stocks mentioned. Thank you for reading.
Market Insights


Advertisement
Community Narratives
The Future of Drug Testing? Fingerprint Tech Shows Serious Promise
Fair Value US$2.98|40.3% undervalued
JO
Community Contributor
Suncorp’s Next Chapter: Insurance-Only and Ready to Grow
Fair Value AU$22.83|7.6% undervalued
RO
Community Contributor
Thyssenkrupp Nucera Will Achieve Double-Digit Profits by 2030 Boosted by Hydrogen Growth
Fair Value €14.40|31.6% undervalued
CH
Community Contributor
Tesla’s Nvidia Moment – The AI & Robotics Inflection Point
Fair Value US$359.72|12.3% undervalued
BL
Community Contributor