
Advertisement
- New Zealand
- /
- Electric Utilities
- /
- NZSE:MCY
Can We See Significant Institutional Ownership On The Mercury NZ Limited (NZSE:MCY) Share Register?

Every investor in Mercury NZ Limited (NZSE:MCY) should be aware of the most powerful shareholder groups. Institutions will often hold stock in bigger companies, and we expect to see insiders owning a noticeable percentage of the smaller ones. We also tend to see lower insider ownership in companies that were previously publicly owned.
Mercury NZ has a market capitalization of NZ$6.5b, so it's too big to fly under the radar. We'd expect to see both institutions and retail investors owning a portion of the company. In the chart below, we can see that institutional investors have bought into the company. Let's delve deeper into each type of owner, to discover more about Mercury NZ.
Check out our latest analysis for Mercury NZ
What Does The Institutional Ownership Tell Us About Mercury NZ?
Institutional investors commonly compare their own returns to the returns of a commonly followed index. So they generally do consider buying larger companies that are included in the relevant benchmark index.
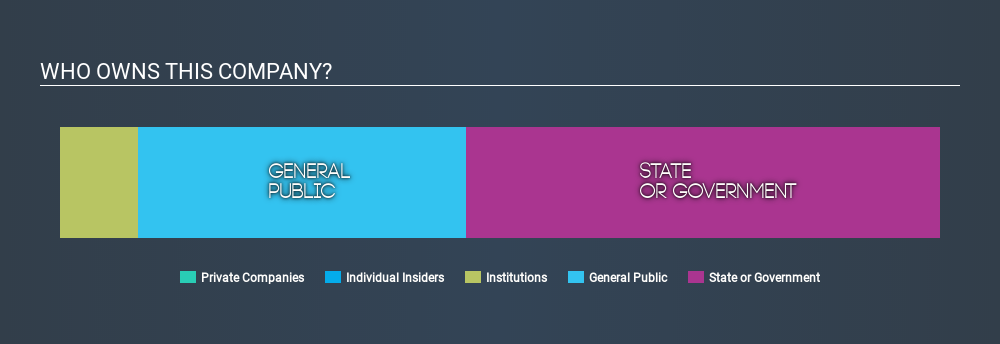
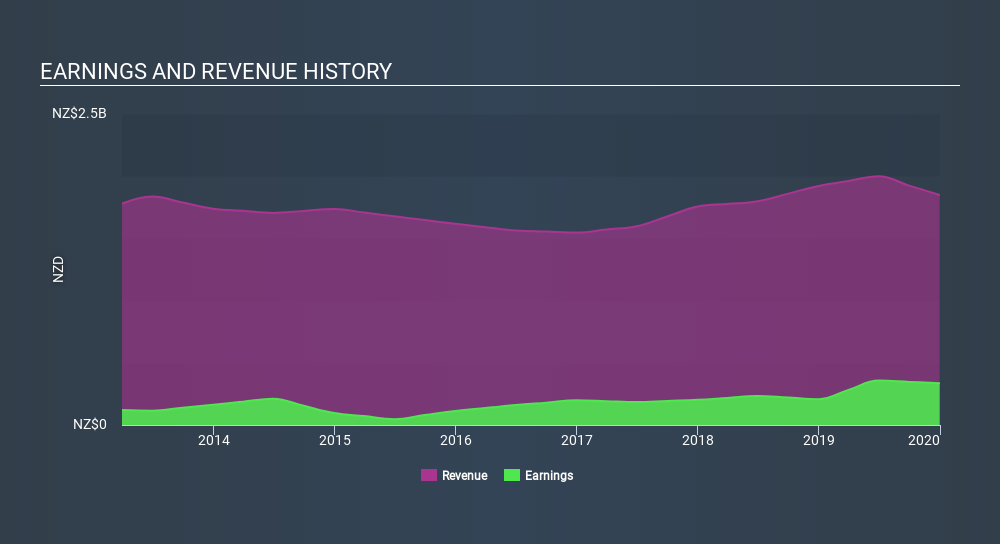
Mercury NZ already has institutions on the share registry. Indeed, they own 9.0% of the company. This implies the analysts working for those institutions have looked at the stock and they like it. But just like anyone else, they could be wrong. When multiple institutions own a stock, there's always a risk that they are in a 'crowded trade'. When such a trade goes wrong, multiple parties may compete to sell stock fast. This risk is higher in a company without a history of growth. You can see Mercury NZ's historic earnings and revenue, below, but keep in mind there's always more to the story.
We note that hedge funds don't have a meaningful investment in Mercury NZ. The New Zealand Government is currently the company's largest shareholder with 54% of shares outstanding. This essentially means that they have extensive influence, if not outright control, over the future of the corporation. The second largest shareholder with 1.6%, is Accident Compensation Corporation, Asset Management Arm, followed by The Vanguard Group, Inc., with an ownership of 1.5%.
While it makes sense to study institutional ownership data for a company, it also makes sense to study analyst sentiments to know which way the wind is blowing. There are plenty of analysts covering the stock, so it might be worth seeing what they are forecasting, too.
Insider Ownership Of Mercury NZ
While the precise definition of an insider can be subjective, almost everyone considers board members to be insiders. The company management answer to the board; and the latter should represent the interests of shareholders. Notably, sometimes top-level managers are on the board, themselves.
Most consider insider ownership a positive because it can indicate the board is well aligned with other shareholders. However, on some occasions too much power is concentrated within this group.
Our data suggests that insiders own under 1% of Mercury NZ Limited in their own names. Keep in mind that it's a big company, and the insiders own NZ$2.7m worth of shares. The absolute value might be more important than the proportional share. It is good to see board members owning shares, but it might be worth checking if those insiders have been buying.
General Public Ownership
The general public holds a 37% stake in MCY. While this group can't necessarily call the shots, it can certainly have a real influence on how the company is run.
Next Steps:
While it is well worth considering the different groups that own a company, there are other factors that are even more important. For instance, we've identified 3 warning signs for Mercury NZ that you should be aware of.
If you would prefer discover what analysts are predicting in terms of future growth, do not miss this free report on analyst forecasts.
NB: Figures in this article are calculated using data from the last twelve months, which refer to the 12-month period ending on the last date of the month the financial statement is dated. This may not be consistent with full year annual report figures.
If you spot an error that warrants correction, please contact the editor at editorial-team@simplywallst.com. This article by Simply Wall St is general in nature. It does not constitute a recommendation to buy or sell any stock, and does not take account of your objectives, or your financial situation. Simply Wall St has no position in the stocks mentioned.
We aim to bring you long-term focused research analysis driven by fundamental data. Note that our analysis may not factor in the latest price-sensitive company announcements or qualitative material. Thank you for reading.
About NZSE:MCY
Mercury NZ
Engages in the production, trading, and sale of electricity and related activities in New Zealand.
Fair value with acceptable track record.
Similar Companies
Market Insights


Advertisement
Community Narratives
For the Emperor: Why Games Workshop Could Be a Star Investment
Fair Value UK£160.00|0.4% overvalued
RO
Community Contributor
Securitas will boost margins with AI and tech-driven services
Fair Value SEK 260.91|44.5% undervalued
UN
Community Contributor
A Leader in EV Charging with Growth Potential
Fair Value €27.00|17.8% undervalued
TI
Community Contributor