- Malaysia
- /
- Trade Distributors
- /
- KLSE:BCMALL
Calculating The Fair Value Of BCM Alliance Berhad (KLSE:BCMALL)


How far off is BCM Alliance Berhad (KLSE:BCMALL) from its intrinsic value? Using the most recent financial data, we'll take a look at whether the stock is fairly priced by taking the expected future cash flows and discounting them to their present value. This is done using the Discounted Cash Flow (DCF) model. It may sound complicated, but actually it is quite simple!
We generally believe that a company's value is the present value of all of the cash it will generate in the future. However, a DCF is just one valuation metric among many, and it is not without flaws. Anyone interested in learning a bit more about intrinsic value should have a read of the Simply Wall St analysis model.
View our latest analysis for BCM Alliance Berhad
The calculation
We are going to use a two-stage DCF model, which, as the name states, takes into account two stages of growth. The first stage is generally a higher growth period which levels off heading towards the terminal value, captured in the second 'steady growth' period. To start off with, we need to estimate the next ten years of cash flows. Seeing as no analyst estimates of free cash flow are available to us, we have extrapolate the previous free cash flow (FCF) from the company's last reported value. We assume companies with shrinking free cash flow will slow their rate of shrinkage, and that companies with growing free cash flow will see their growth rate slow, over this period. We do this to reflect that growth tends to slow more in the early years than it does in later years.
A DCF is all about the idea that a dollar in the future is less valuable than a dollar today, so we need to discount the sum of these future cash flows to arrive at a present value estimate:
10-year free cash flow (FCF) estimate
| 2020 | 2021 | 2022 | 2023 | 2024 | 2025 | 2026 | 2027 | 2028 | 2029 | |
| Levered FCF (MYR, Millions) | RM3.31m | RM2.54m | RM2.16m | RM1.95m | RM1.84m | RM1.79m | RM1.77m | RM1.77m | RM1.80m | RM1.83m |
| Growth Rate Estimate Source | Est @ -34.46% | Est @ -23.1% | Est @ -15.14% | Est @ -9.57% | Est @ -5.68% | Est @ -2.95% | Est @ -1.04% | Est @ 0.3% | Est @ 1.24% | Est @ 1.89% |
| Present Value (MYR, Millions) Discounted @ 11% | RM3.0 | RM2.1 | RM1.6 | RM1.3 | RM1.1 | RM1.0 | RM0.9 | RM0.8 | RM0.7 | RM0.7 |
("Est" = FCF growth rate estimated by Simply Wall St)
Present Value of 10-year Cash Flow (PVCF) = RM13m
After calculating the present value of future cash flows in the intial 10-year period, we need to calculate the Terminal Value, which accounts for all future cash flows beyond the first stage. For a number of reasons a very conservative growth rate is used that cannot exceed that of a country's GDP growth. In this case we have used the 10-year government bond rate (3.4%) to estimate future growth. In the same way as with the 10-year 'growth' period, we discount future cash flows to today's value, using a cost of equity of 11%.
Terminal Value (TV)= FCF2029 × (1 + g) ÷ (r – g) = RM1.8m× (1 + 3.4%) ÷ 11%– 3.4%) = RM26m
Present Value of Terminal Value (PVTV)= TV / (1 + r)10= RM26m÷ ( 1 + 11%)10= RM9.5m
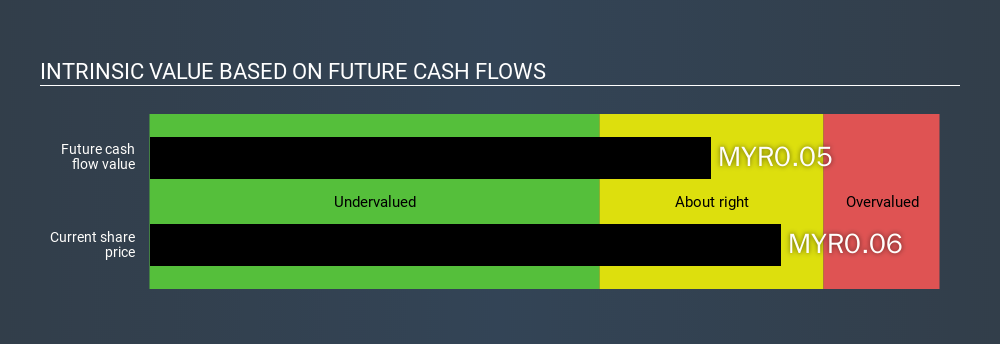
The total value, or equity value, is then the sum of the present value of the future cash flows, which in this case is RM22m. In the final step we divide the equity value by the number of shares outstanding. Relative to the current share price of RM0.06, the company appears around fair value at the time of writing. Valuations are imprecise instruments though, rather like a telescope - move a few degrees and end up in a different galaxy. Do keep this in mind.
The assumptions
We would point out that the most important inputs to a discounted cash flow are the discount rate and of course the actual cash flows. Part of investing is coming up with your own evaluation of a company's future performance, so try the calculation yourself and check your own assumptions. The DCF also does not consider the possible cyclicality of an industry, or a company's future capital requirements, so it does not give a full picture of a company's potential performance. Given that we are looking at BCM Alliance Berhad as potential shareholders, the cost of equity is used as the discount rate, rather than the cost of capital (or weighted average cost of capital, WACC) which accounts for debt. In this calculation we've used 11%, which is based on a levered beta of 1.041. Beta is a measure of a stock's volatility, compared to the market as a whole. We get our beta from the industry average beta of globally comparable companies, with an imposed limit between 0.8 and 2.0, which is a reasonable range for a stable business.
Next Steps:
Although the valuation of a company is important, it shouldn’t be the only metric you look at when researching a company. The DCF model is not a perfect stock valuation tool. Rather it should be seen as a guide to "what assumptions need to be true for this stock to be under/overvalued?" If a company grows at a different rate, or if its cost of equity or risk free rate changes sharply, the output can look very different. For BCM Alliance Berhad, There are three essential factors you should further research:
- Risks: Be aware that BCM Alliance Berhad is showing 4 warning signs in our investment analysis , and 1 of those is concerning...
- Other High Quality Alternatives: Do you like a good all-rounder? Explore our interactive list of high quality stocks to get an idea of what else is out there you may be missing!
- Other Top Analyst Picks: Interested to see what the analysts are thinking? Take a look at our interactive list of analysts' top stock picks to find out what they feel might have an attractive future outlook!
PS. Simply Wall St updates its DCF calculation for every MY stock every day, so if you want to find the intrinsic value of any other stock just search here.
If you spot an error that warrants correction, please contact the editor at editorial-team@simplywallst.com. This article by Simply Wall St is general in nature. It does not constitute a recommendation to buy or sell any stock, and does not take account of your objectives, or your financial situation. Simply Wall St has no position in the stocks mentioned.
We aim to bring you long-term focused research analysis driven by fundamental data. Note that our analysis may not factor in the latest price-sensitive company announcements or qualitative material. Thank you for reading.
About KLSE:BCMALL
BCM Alliance Berhad
An investment holding company, distributes commercial laundry equipment, medical devices, and healthcare products in Malaysia and internationally.
Flawless balance sheet low.
Market Insights

Community Narratives

