Stock Analysis
- Finland
- /
- Paper and Forestry Products
- /
- HLSE:UPM
UPM-Kymmene Oyj's (HEL:UPM) investors will be pleased with their notable 50% return over the last five years

It hasn't been the best quarter for UPM-Kymmene Oyj (HEL:UPM) shareholders, since the share price has fallen 11% in that time. But that doesn't change the fact that the returns over the last five years have been pleasing. It has returned a market beating 22% in that time.
So let's assess the underlying fundamentals over the last 5 years and see if they've moved in lock-step with shareholder returns.
View our latest analysis for UPM-Kymmene Oyj
While markets are a powerful pricing mechanism, share prices reflect investor sentiment, not just underlying business performance. One imperfect but simple way to consider how the market perception of a company has shifted is to compare the change in the earnings per share (EPS) with the share price movement.
During five years of share price growth, UPM-Kymmene Oyj actually saw its EPS drop 24% per year.
Since the EPS are down strongly, it seems highly unlikely market participants are looking at EPS to value the company. Given that EPS is down, but the share price is up, it seems clear the market is focussed on other aspects of the business, at the moment.
In fact, the dividend has increased over time, which is a positive. Maybe dividend investors have helped support the share price.
You can see how earnings and revenue have changed over time in the image below (click on the chart to see the exact values).
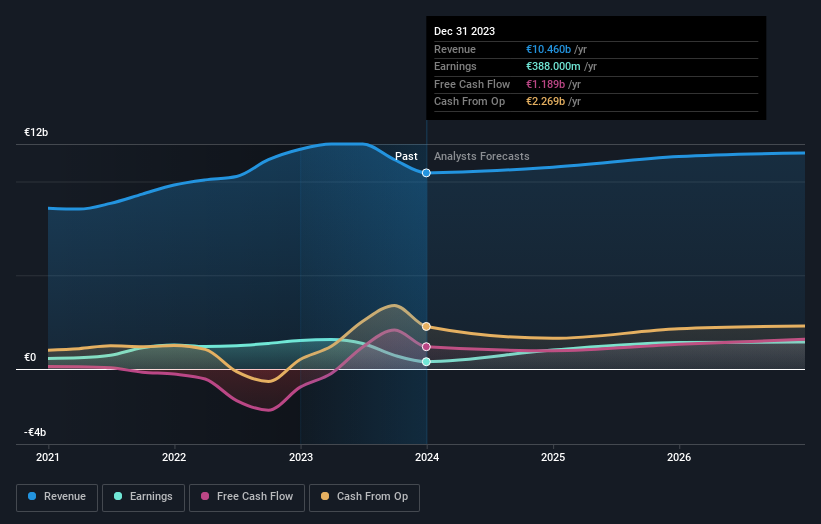
It's good to see that there was some significant insider buying in the last three months. That's a positive. On the other hand, we think the revenue and earnings trends are much more meaningful measures of the business. So it makes a lot of sense to check out what analysts think UPM-Kymmene Oyj will earn in the future (free profit forecasts).
What About Dividends?
It is important to consider the total shareholder return, as well as the share price return, for any given stock. The TSR is a return calculation that accounts for the value of cash dividends (assuming that any dividend received was reinvested) and the calculated value of any discounted capital raisings and spin-offs. So for companies that pay a generous dividend, the TSR is often a lot higher than the share price return. As it happens, UPM-Kymmene Oyj's TSR for the last 5 years was 50%, which exceeds the share price return mentioned earlier. This is largely a result of its dividend payments!
A Different Perspective
It's nice to see that UPM-Kymmene Oyj shareholders have received a total shareholder return of 9.2% over the last year. Of course, that includes the dividend. That gain is better than the annual TSR over five years, which is 8%. Therefore it seems like sentiment around the company has been positive lately. Given the share price momentum remains strong, it might be worth taking a closer look at the stock, lest you miss an opportunity. While it is well worth considering the different impacts that market conditions can have on the share price, there are other factors that are even more important. For example, we've discovered 3 warning signs for UPM-Kymmene Oyj that you should be aware of before investing here.
There are plenty of other companies that have insiders buying up shares. You probably do not want to miss this free list of growing companies that insiders are buying.
Please note, the market returns quoted in this article reflect the market weighted average returns of stocks that currently trade on Finnish exchanges.
Valuation is complex, but we're helping make it simple.
Find out whether UPM-Kymmene Oyj is potentially over or undervalued by checking out our comprehensive analysis, which includes fair value estimates, risks and warnings, dividends, insider transactions and financial health.
View the Free AnalysisHave feedback on this article? Concerned about the content? Get in touch with us directly. Alternatively, email editorial-team (at) simplywallst.com.
This article by Simply Wall St is general in nature. We provide commentary based on historical data and analyst forecasts only using an unbiased methodology and our articles are not intended to be financial advice. It does not constitute a recommendation to buy or sell any stock, and does not take account of your objectives, or your financial situation. We aim to bring you long-term focused analysis driven by fundamental data. Note that our analysis may not factor in the latest price-sensitive company announcements or qualitative material. Simply Wall St has no position in any stocks mentioned.

Simply Wall St
About HLSE:UPM
UPM-Kymmene Oyj
UPM-Kymmene Oyj, together with its subsidiaries, engages in the forest-based bioindustry in Europe, North America, Asia, and internationally.
Excellent balance sheet with reasonable growth potential and pays a dividend.
