Stock Analysis
- Poland
- /
- Oil and Gas
- /
- WSE:PKN
The five-year underlying earnings growth at Orlen (WSE:PKN) is promising, but the shareholders are still in the red over that time


Orlen S.A. (WSE:PKN) shareholders should be happy to see the share price up 14% in the last quarter. But if you look at the last five years the returns have not been good. After all, the share price is down 33% in that time, significantly under-performing the market.
With the stock having lost 3.1% in the past week, it's worth taking a look at business performance and seeing if there's any red flags.
View our latest analysis for Orlen
To paraphrase Benjamin Graham: Over the short term the market is a voting machine, but over the long term it's a weighing machine. By comparing earnings per share (EPS) and share price changes over time, we can get a feel for how investor attitudes to a company have morphed over time.
While the share price declined over five years, Orlen actually managed to increase EPS by an average of 13% per year. So it doesn't seem like EPS is a great guide to understanding how the market is valuing the stock. Or possibly, the market was previously very optimistic, so the stock has disappointed, despite improving EPS.
Due to the lack of correlation between the EPS growth and the falling share price, it's worth taking a look at other metrics to try to understand the share price movement.
We note that the dividend has remained healthy, so that wouldn't really explain the share price drop. It's not immediately clear to us why the stock price is down but further research might provide some answers.
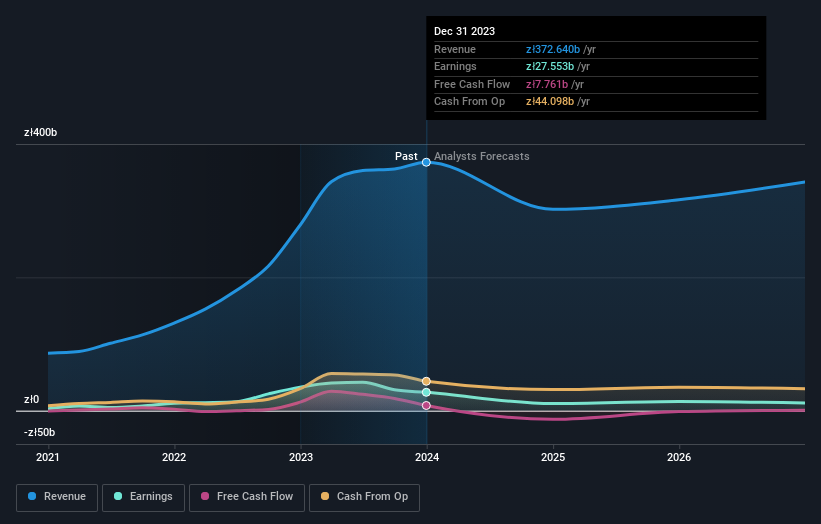
You can see below how earnings and revenue have changed over time (discover the exact values by clicking on the image).
We know that Orlen has improved its bottom line over the last three years, but what does the future have in store? If you are thinking of buying or selling Orlen stock, you should check out this FREE detailed report on its balance sheet.
What About Dividends?
When looking at investment returns, it is important to consider the difference between total shareholder return (TSR) and share price return. The TSR is a return calculation that accounts for the value of cash dividends (assuming that any dividend received was reinvested) and the calculated value of any discounted capital raisings and spin-offs. It's fair to say that the TSR gives a more complete picture for stocks that pay a dividend. In the case of Orlen, it has a TSR of -16% for the last 5 years. That exceeds its share price return that we previously mentioned. The dividends paid by the company have thusly boosted the total shareholder return.
A Different Perspective
Orlen shareholders are up 19% for the year (even including dividends). But that return falls short of the market. On the bright side, that's still a gain, and it is certainly better than the yearly loss of about 3% endured over half a decade. So this might be a sign the business has turned its fortunes around. It's always interesting to track share price performance over the longer term. But to understand Orlen better, we need to consider many other factors. Case in point: We've spotted 3 warning signs for Orlen you should be aware of, and 1 of them can't be ignored.
But note: Orlen may not be the best stock to buy. So take a peek at this free list of interesting companies with past earnings growth (and further growth forecast).
Please note, the market returns quoted in this article reflect the market weighted average returns of stocks that currently trade on Polish exchanges.
Valuation is complex, but we're helping make it simple.
Find out whether Orlen is potentially over or undervalued by checking out our comprehensive analysis, which includes fair value estimates, risks and warnings, dividends, insider transactions and financial health.
View the Free AnalysisHave feedback on this article? Concerned about the content? Get in touch with us directly. Alternatively, email editorial-team (at) simplywallst.com.
This article by Simply Wall St is general in nature. We provide commentary based on historical data and analyst forecasts only using an unbiased methodology and our articles are not intended to be financial advice. It does not constitute a recommendation to buy or sell any stock, and does not take account of your objectives, or your financial situation. We aim to bring you long-term focused analysis driven by fundamental data. Note that our analysis may not factor in the latest price-sensitive company announcements or qualitative material. Simply Wall St has no position in any stocks mentioned.
About WSE:PKN
Orlen
Orlen S.A. operates in refining, petrochemical, energy, retail, gas, and upstream business.
Very undervalued with flawless balance sheet and pays a dividend.
