Stock Analysis


David Iben put it well when he said, 'Volatility is not a risk we care about. What we care about is avoiding the permanent loss of capital.' When we think about how risky a company is, we always like to look at its use of debt, since debt overload can lead to ruin. We can see that Trinity Industries, Inc. (NYSE:TRN) does use debt in its business. But the more important question is: how much risk is that debt creating?
Why Does Debt Bring Risk?
Generally speaking, debt only becomes a real problem when a company can't easily pay it off, either by raising capital or with its own cash flow. Ultimately, if the company can't fulfill its legal obligations to repay debt, shareholders could walk away with nothing. However, a more common (but still painful) scenario is that it has to raise new equity capital at a low price, thus permanently diluting shareholders. Of course, the upside of debt is that it often represents cheap capital, especially when it replaces dilution in a company with the ability to reinvest at high rates of return. When we think about a company's use of debt, we first look at cash and debt together.
See our latest analysis for Trinity Industries
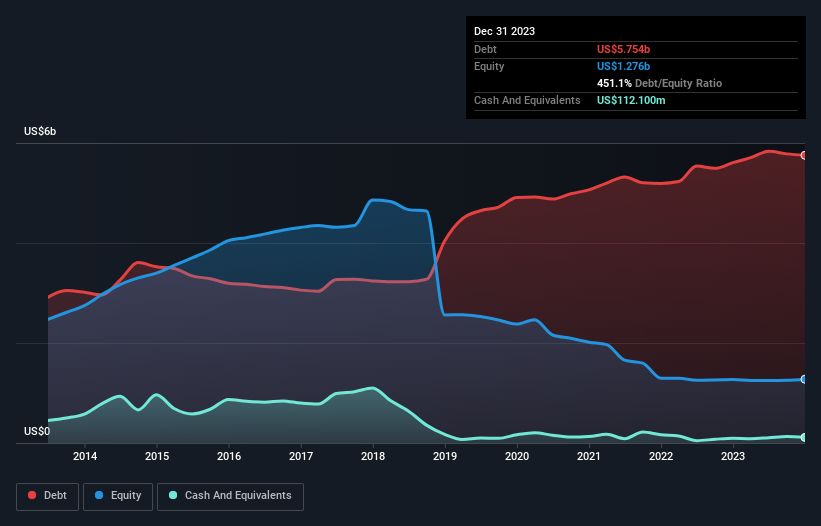
How Much Debt Does Trinity Industries Carry?
As you can see below, Trinity Industries had US$5.75b of debt, at December 2023, which is about the same as the year before. You can click the chart for greater detail. Net debt is about the same, since the it doesn't have much cash.
A Look At Trinity Industries' Liabilities
We can see from the most recent balance sheet that Trinity Industries had liabilities of US$627.7m falling due within a year, and liabilities of US$7.00b due beyond that. Offsetting this, it had US$112.1m in cash and US$211.0m in receivables that were due within 12 months. So it has liabilities totalling US$7.31b more than its cash and near-term receivables, combined.
The deficiency here weighs heavily on the US$2.14b company itself, as if a child were struggling under the weight of an enormous back-pack full of books, his sports gear, and a trumpet. So we definitely think shareholders need to watch this one closely. After all, Trinity Industries would likely require a major re-capitalisation if it had to pay its creditors today.
We use two main ratios to inform us about debt levels relative to earnings. The first is net debt divided by earnings before interest, tax, depreciation, and amortization (EBITDA), while the second is how many times its earnings before interest and tax (EBIT) covers its interest expense (or its interest cover, for short). Thus we consider debt relative to earnings both with and without depreciation and amortization expenses.
Trinity Industries shareholders face the double whammy of a high net debt to EBITDA ratio (9.1), and fairly weak interest coverage, since EBIT is just 1.2 times the interest expense. The debt burden here is substantial. Looking on the bright side, Trinity Industries boosted its EBIT by a silky 79% in the last year. Like the milk of human kindness that sort of growth increases resilience, making the company more capable of managing debt. There's no doubt that we learn most about debt from the balance sheet. But it is future earnings, more than anything, that will determine Trinity Industries's ability to maintain a healthy balance sheet going forward. So if you're focused on the future you can check out this free report showing analyst profit forecasts.
Finally, a business needs free cash flow to pay off debt; accounting profits just don't cut it. So we clearly need to look at whether that EBIT is leading to corresponding free cash flow. During the last three years, Trinity Industries burned a lot of cash. While that may be a result of expenditure for growth, it does make the debt far more risky.
Our View
On the face of it, Trinity Industries's conversion of EBIT to free cash flow left us tentative about the stock, and its level of total liabilities was no more enticing than the one empty restaurant on the busiest night of the year. But on the bright side, its EBIT growth rate is a good sign, and makes us more optimistic. After considering the datapoints discussed, we think Trinity Industries has too much debt. That sort of riskiness is ok for some, but it certainly doesn't float our boat. There's no doubt that we learn most about debt from the balance sheet. However, not all investment risk resides within the balance sheet - far from it. These risks can be hard to spot. Every company has them, and we've spotted 4 warning signs for Trinity Industries (of which 1 doesn't sit too well with us!) you should know about.
Of course, if you're the type of investor who prefers buying stocks without the burden of debt, then don't hesitate to discover our exclusive list of net cash growth stocks, today.
Valuation is complex, but we're helping make it simple.
Find out whether Trinity Industries is potentially over or undervalued by checking out our comprehensive analysis, which includes fair value estimates, risks and warnings, dividends, insider transactions and financial health.
View the Free AnalysisHave feedback on this article? Concerned about the content? Get in touch with us directly. Alternatively, email editorial-team (at) simplywallst.com.
This article by Simply Wall St is general in nature. We provide commentary based on historical data and analyst forecasts only using an unbiased methodology and our articles are not intended to be financial advice. It does not constitute a recommendation to buy or sell any stock, and does not take account of your objectives, or your financial situation. We aim to bring you long-term focused analysis driven by fundamental data. Note that our analysis may not factor in the latest price-sensitive company announcements or qualitative material. Simply Wall St has no position in any stocks mentioned.
About NYSE:TRN
Trinity Industries
Trinity Industries, Inc. provides rail transportation products and services under the TrinityRail name in North America.
Average dividend payer and slightly overvalued.
