Stock Analysis
- Germany
- /
- Consumer Durables
- /
- XTRA:SUR
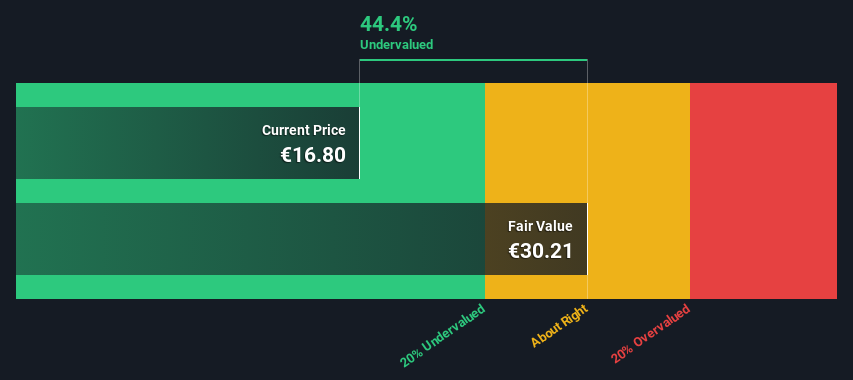
An Intrinsic Calculation For Surteco Group SE (ETR:SUR) Suggests It's 44% Undervalued

Key Insights
- The projected fair value for Surteco Group is €30.21 based on 2 Stage Free Cash Flow to Equity
- Current share price of €16.80 suggests Surteco Group is potentially 44% undervalued
- Surteco Group's peers are currently trading at a premium of 69% on average
In this article we are going to estimate the intrinsic value of Surteco Group SE (ETR:SUR) by estimating the company's future cash flows and discounting them to their present value. This will be done using the Discounted Cash Flow (DCF) model. Before you think you won't be able to understand it, just read on! It's actually much less complex than you'd imagine.
Companies can be valued in a lot of ways, so we would point out that a DCF is not perfect for every situation. If you want to learn more about discounted cash flow, the rationale behind this calculation can be read in detail in the Simply Wall St analysis model.
View our latest analysis for Surteco Group
Step By Step Through The Calculation
We're using the 2-stage growth model, which simply means we take in account two stages of company's growth. In the initial period the company may have a higher growth rate and the second stage is usually assumed to have a stable growth rate. To start off with, we need to estimate the next ten years of cash flows. Where possible we use analyst estimates, but when these aren't available we extrapolate the previous free cash flow (FCF) from the last estimate or reported value. We assume companies with shrinking free cash flow will slow their rate of shrinkage, and that companies with growing free cash flow will see their growth rate slow, over this period. We do this to reflect that growth tends to slow more in the early years than it does in later years.
A DCF is all about the idea that a dollar in the future is less valuable than a dollar today, so we discount the value of these future cash flows to their estimated value in today's dollars:
10-year free cash flow (FCF) forecast
| 2024 | 2025 | 2026 | 2027 | 2028 | 2029 | 2030 | 2031 | 2032 | 2033 | |
| Levered FCF (€, Millions) | €45.8m | €50.3m | €57.0m | €40.5m | €46.4m | €44.6m | €43.5m | €42.8m | €42.4m | €42.1m |
| Growth Rate Estimate Source | Analyst x2 | Analyst x2 | Analyst x2 | Analyst x1 | Analyst x1 | Est @ -3.88% | Est @ -2.54% | Est @ -1.61% | Est @ -0.96% | Est @ -0.50% |
| Present Value (€, Millions) Discounted @ 9.8% | €41.7 | €41.7 | €43.1 | €27.9 | €29.1 | €25.5 | €22.6 | €20.3 | €18.3 | €16.6 |
("Est" = FCF growth rate estimated by Simply Wall St)
Present Value of 10-year Cash Flow (PVCF) = €287m
After calculating the present value of future cash flows in the initial 10-year period, we need to calculate the Terminal Value, which accounts for all future cash flows beyond the first stage. The Gordon Growth formula is used to calculate Terminal Value at a future annual growth rate equal to the 5-year average of the 10-year government bond yield of 0.6%. We discount the terminal cash flows to today's value at a cost of equity of 9.8%.
Terminal Value (TV)= FCF2033 × (1 + g) ÷ (r – g) = €42m× (1 + 0.6%) ÷ (9.8%– 0.6%) = €461m
Present Value of Terminal Value (PVTV)= TV / (1 + r)10= €461m÷ ( 1 + 9.8%)10= €182m
The total value is the sum of cash flows for the next ten years plus the discounted terminal value, which results in the Total Equity Value, which in this case is €468m. In the final step we divide the equity value by the number of shares outstanding. Relative to the current share price of €16.8, the company appears quite good value at a 44% discount to where the stock price trades currently. The assumptions in any calculation have a big impact on the valuation, so it is better to view this as a rough estimate, not precise down to the last cent.
The Assumptions
We would point out that the most important inputs to a discounted cash flow are the discount rate and of course the actual cash flows. Part of investing is coming up with your own evaluation of a company's future performance, so try the calculation yourself and check your own assumptions. The DCF also does not consider the possible cyclicality of an industry, or a company's future capital requirements, so it does not give a full picture of a company's potential performance. Given that we are looking at Surteco Group as potential shareholders, the cost of equity is used as the discount rate, rather than the cost of capital (or weighted average cost of capital, WACC) which accounts for debt. In this calculation we've used 9.8%, which is based on a levered beta of 2.000. Beta is a measure of a stock's volatility, compared to the market as a whole. We get our beta from the industry average beta of globally comparable companies, with an imposed limit between 0.8 and 2.0, which is a reasonable range for a stable business.
SWOT Analysis for Surteco Group
- Debt is well covered by earnings and cashflows.
- Dividend is low compared to the top 25% of dividend payers in the Consumer Durables market.
- Expected to breakeven next year.
- Has sufficient cash runway for more than 3 years based on current free cash flows.
- Good value based on P/S ratio and estimated fair value.
- Paying a dividend but company is unprofitable.
Next Steps:
Whilst important, the DCF calculation ideally won't be the sole piece of analysis you scrutinize for a company. It's not possible to obtain a foolproof valuation with a DCF model. Preferably you'd apply different cases and assumptions and see how they would impact the company's valuation. For example, changes in the company's cost of equity or the risk free rate can significantly impact the valuation. What is the reason for the share price sitting below the intrinsic value? For Surteco Group, there are three pertinent elements you should explore:
- Risks: For example, we've discovered 2 warning signs for Surteco Group that you should be aware of before investing here.
- Future Earnings: How does SUR's growth rate compare to its peers and the wider market? Dig deeper into the analyst consensus number for the upcoming years by interacting with our free analyst growth expectation chart.
- Other High Quality Alternatives: Do you like a good all-rounder? Explore our interactive list of high quality stocks to get an idea of what else is out there you may be missing!
PS. The Simply Wall St app conducts a discounted cash flow valuation for every stock on the XTRA every day. If you want to find the calculation for other stocks just search here.
Valuation is complex, but we're helping make it simple.
Find out whether Surteco Group is potentially over or undervalued by checking out our comprehensive analysis, which includes fair value estimates, risks and warnings, dividends, insider transactions and financial health.
View the Free AnalysisHave feedback on this article? Concerned about the content? Get in touch with us directly. Alternatively, email editorial-team (at) simplywallst.com.
This article by Simply Wall St is general in nature. We provide commentary based on historical data and analyst forecasts only using an unbiased methodology and our articles are not intended to be financial advice. It does not constitute a recommendation to buy or sell any stock, and does not take account of your objectives, or your financial situation. We aim to bring you long-term focused analysis driven by fundamental data. Note that our analysis may not factor in the latest price-sensitive company announcements or qualitative material. Simply Wall St has no position in any stocks mentioned.

Simply Wall St
About XTRA:SUR
Surteco Group
Surteco Group SE develops, produces, and sells coated surface materials based on paper and plastic in Germany, rest of Europe, the United States, Asia, Australia, and internationally.
Undervalued with moderate growth potential.
