Advertisement
- India
- /
- Electric Utilities
- /
- NSEI:ENERGYDEV
Are Investors Concerned With What's Going On At Energy Development (NSE:ENERGYDEV)?
When we're researching a company, it's sometimes hard to find the warning signs, but there are some financial metrics that can help spot trouble early. Businesses in decline often have two underlying trends, firstly, a declining return on capital employed (ROCE) and a declining base of capital employed. Ultimately this means that the company is earning less per dollar invested and on top of that, it's shrinking its base of capital employed. So after we looked into Energy Development (NSE:ENERGYDEV), the trends above didn't look too great.
Return On Capital Employed (ROCE): What is it?
For those who don't know, ROCE is a measure of a company's yearly pre-tax profit (its return), relative to the capital employed in the business. Analysts use this formula to calculate it for Energy Development:
Return on Capital Employed = Earnings Before Interest and Tax (EBIT) ÷ (Total Assets - Current Liabilities)
0.0078 = ₹19m ÷ (₹3.5b - ₹974m) (Based on the trailing twelve months to March 2020).
So, Energy Development has an ROCE of 0.8%. Ultimately, that's a low return and it under-performs the Electric Utilities industry average of 8.6%.
See our latest analysis for Energy Development
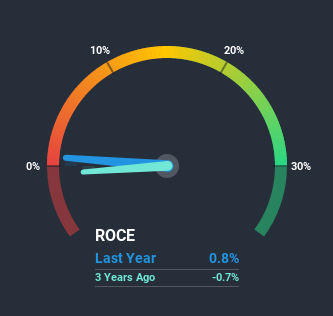
Historical performance is a great place to start when researching a stock so above you can see the gauge for Energy Development's ROCE against it's prior returns. If you'd like to look at how Energy Development has performed in the past in other metrics, you can view this free graph of past earnings, revenue and cash flow.
What The Trend Of ROCE Can Tell Us
We are a bit anxious about the trends of ROCE at Energy Development. The company used to generate 3.4% on its capital five years ago but it has since fallen noticeably. What's equally concerning is that the amount of capital deployed in the business has shrunk by 46% over that same period. The fact that both are shrinking is an indication that the business is going through some tough times. If these underlying trends continue, we wouldn't be too optimistic going forward.
On a side note, Energy Development's current liabilities have increased over the last five years to 28% of total assets, effectively distorting the ROCE to some degree. Without this increase, it's likely that ROCE would be even lower than 0.8%. Keep an eye on this ratio, because the business could encounter some new risks if this metric gets too high.In Conclusion...
In summary, it's unfortunate that Energy Development is shrinking its capital base and also generating lower returns. It should come as no surprise then that the stock has fallen 67% over the last five years, so it looks like investors are recognizing these changes. That being the case, unless the underlying trends revert to a more positive trajectory, we'd consider looking elsewhere.
One more thing: We've identified 4 warning signs with Energy Development (at least 1 which is potentially serious) , and understanding these would certainly be useful.
While Energy Development may not currently earn the highest returns, we've compiled a list of companies that currently earn more than 25% return on equity. Check out this free list here.
If you’re looking to trade Energy Development, open an account with the lowest-cost* platform trusted by professionals, Interactive Brokers. Their clients from over 200 countries and territories trade stocks, options, futures, forex, bonds and funds worldwide from a single integrated account. Promoted
Valuation is complex, but we're here to simplify it.
Discover if Energy Development might be undervalued or overvalued with our detailed analysis, featuring fair value estimates, potential risks, dividends, insider trades, and its financial condition.
Access Free AnalysisThis article by Simply Wall St is general in nature. It does not constitute a recommendation to buy or sell any stock, and does not take account of your objectives, or your financial situation. We aim to bring you long-term focused analysis driven by fundamental data. Note that our analysis may not factor in the latest price-sensitive company announcements or qualitative material. Simply Wall St has no position in any stocks mentioned.
*Interactive Brokers Rated Lowest Cost Broker by StockBrokers.com Annual Online Review 2020
Have feedback on this article? Concerned about the content? Get in touch with us directly. Alternatively, email editorial-team@simplywallst.com.
About NSEI:ENERGYDEV
Energy Development
Generates and sells electricity from water and wind to various electricity boards in India.
Slight risk and slightly overvalued.
Market Insights


Advertisement
Weekly Picks
LO


Lou_Basenese on Giftify ·
Giftify ($GIFT): A Small-Cap Incentives Platform with More ScaleThan Its Valuation Suggests
Fair Value:US$2.563.5% undervalued
59 followersusers have followed this narrative
2 commentsusers have commented on this narrative
11 likesusers have liked this narrative
HA


HarishPK on lululemon athletica ·
Quantifying the Transition: Why Lululemon’s Moat Remains Intact
Fair Value:US$161.826.3% undervalued
22 followersusers have followed this narrative
2 commentsusers have commented on this narrative
9 likesusers have liked this narrative
TR


tripledub on Alphabet ·
Warren Buffett Just Bet $10 Billion on Google. The Catch? You May Already Be Too Late.
Fair Value:US$23055.3% overvalued
60 followersusers have followed this narrative
1 commentusers have commented on this narrative
16 likesusers have liked this narrative
JO


John_Eric on Veeva Systems ·
AI-Powered Veeva Systems Poised for Solid Growth Amid Regulatory Stability
Fair Value:US$32040.6% undervalued
32 followersusers have followed this narrative
0 commentsusers have commented on this narrative
6 likesusers have liked this narrative
Recently Updated Narratives
TI

TimLee on Minox International Group Berhad ·
Minox International: Undervalued Industrial Play with High-Tech Catalysts
Fair Value:RM 0.3555.7% undervalued
1 followerusers have followed this narrative
0 commentsusers have commented on this narrative
0 likesusers have liked this narrative
JO

John_Eric on Workday ·
Workday's Backlog Just Grew Faster Than Its Revenue.The Market Shrugged.
Fair Value:US$165.616.1% undervalued
1 followerusers have followed this narrative
0 commentsusers have commented on this narrative
0 likesusers have liked this narrative
RO


RockeTeller on Aftermath Silver ·
Aftermath Silver, A 35% Insider-Aligned Silver Stock With a Giant Critical Metals Twist
Fair Value:CA$30.3797.8% undervalued
6 followersusers have followed this narrative
2 commentsusers have commented on this narrative
1 likeusers have liked this narrative
Popular Narratives
IN


Investingwilly on Mastercard ·
Mastercard: The Best Dividend Stock You're Ignoring
Fair Value:US$75029.8% undervalued
87 followersusers have followed this narrative
1 commentusers have commented on this narrative
9 likesusers have liked this narrative
BL


BlackGoat on Cerebras Systems ·
The Wafer Giant Threatening NVIDIA's GPU Hegemony
Fair Value:US$415.5448.2% undervalued
60 followersusers have followed this narrative
3 commentsusers have commented on this narrative
11 likesusers have liked this narrative
TR
tripledub on Alphabet ·
Warren Buffett Just Bet $10 Billion on Google. The Catch? You May Already Be Too Late.
Fair Value:US$23055.3% overvalued
60 followersusers have followed this narrative
1 commentusers have commented on this narrative
16 likesusers have liked this narrative
