
Advertisement
- India
- /
- Electric Utilities
- /
- NSEI:ADANIENSOL
Adani Transmission Limited's (NSE:ADANITRANS) Share Price Matching Investor Opinion

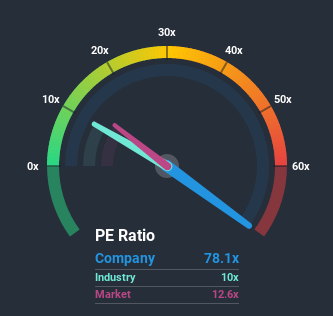
When close to half the companies in India have price-to-earnings ratios (or "P/E's") below 12x, you may consider Adani Transmission Limited (NSE:ADANITRANS) as a stock to avoid entirely with its 78.1x P/E ratio. Although, it's not wise to just take the P/E at face value as there may be an explanation why it's so lofty.
With earnings growth that's superior to most other companies of late, Adani Transmission has been doing relatively well. The P/E is probably high because investors think this strong earnings performance will continue. You'd really hope so, otherwise you're paying a pretty hefty price for no particular reason.
View our latest analysis for Adani Transmission
Does Adani Transmission Have A Relatively High Or Low P/E For Its Industry?
It's plausible that Adani Transmission's particularly high P/E ratio could be a result of tendencies within its own industry. It turns out the Electric Utilities industry in general has a P/E ratio lower than the market, as the graphic below shows. So unfortunately this doesn't provide much to explain the company's ratio at all right now. In the context of the Electric Utilities industry's current setting, most of its constituents' P/E's would be expected to be toned down. Still, the strength of the company's earnings will most likely determine where its P/E shall sit.
How Is Adani Transmission's Growth Trending?
The only time you'd be truly comfortable seeing a P/E as steep as Adani Transmission's is when the company's growth is on track to outshine the market decidedly.
Taking a look back first, we see that the company grew earnings per share by an impressive 41% last year. Still, incredibly EPS has fallen 14% in total from three years ago, which is quite disappointing. Therefore, it's fair to say the earnings growth recently has been undesirable for the company.
Turning to the outlook, the next three years should generate growth of 52% per annum as estimated by the three analysts watching the company. That's shaping up to be materially higher than the 14% per annum growth forecast for the broader market.
With this information, we can see why Adani Transmission is trading at such a high P/E compared to the market. It seems most investors are expecting this strong future growth and are willing to pay more for the stock.
The Final Word
The price-to-earnings ratio's power isn't primarily as a valuation instrument but rather to gauge current investor sentiment and future expectations.
We've established that Adani Transmission maintains its high P/E on the strength of its forecast growth being higher than the wider market, as expected. Right now shareholders are comfortable with the P/E as they are quite confident future earnings aren't under threat. Unless these conditions change, they will continue to provide strong support to the share price.
It's always necessary to consider the ever-present spectre of investment risk. We've identified 2 warning signs with Adani Transmission (at least 1 which can't be ignored), and understanding them should be part of your investment process.
You might be able to find a better investment than Adani Transmission. If you want a selection of possible candidates, check out this free list of interesting companies that trade on a P/E below 20x (but have proven they can grow earnings).
If you decide to trade Adani Transmission, use the lowest-cost* platform that is rated #1 Overall by Barron’s, Interactive Brokers. Trade stocks, options, futures, forex, bonds and funds on 135 markets, all from a single integrated account.Promoted
New: Manage All Your Stock Portfolios in One Place
We've created the ultimate portfolio companion for stock investors, and it's free.
• Connect an unlimited number of Portfolios and see your total in one currency
• Be alerted to new Warning Signs or Risks via email or mobile
• Track the Fair Value of your stocks
This article by Simply Wall St is general in nature. It does not constitute a recommendation to buy or sell any stock, and does not take account of your objectives, or your financial situation. We aim to bring you long-term focused analysis driven by fundamental data. Note that our analysis may not factor in the latest price-sensitive company announcements or qualitative material. Simply Wall St has no position in any stocks mentioned.
*Interactive Brokers Rated Lowest Cost Broker by StockBrokers.com Annual Online Review 2020
Have feedback on this article? Concerned about the content? Get in touch with us directly. Alternatively, email editorial-team@simplywallst.com.
About NSEI:ADANIENSOL
Adani Energy Solutions
Generates, transmits, and distributes power in India.
Reasonable growth potential with mediocre balance sheet.
Similar Companies
Market Insights

Advertisement
Community Narratives
Groundbreaking therapies that could change the treatment landscape for PTSD, fibromyalgia, MS & Alzheimer’s
Fair Value US$6.20|82.7% undervalued
CM
Community Contributor
DigitalOcean Will Grow 14% by Embracing AI with Paperspace Acquisition
Fair Value US$50.00|36.8% undervalued
NE
Community Contributor
Viant Technology: A Rising AdTech Challenger in the AI-Powered CTV Market
Fair Value US$38.61|61.4% undervalued
BL
Community Contributor
Volvo will Accelerate Forward into Electric and Autonomous Leadership in Five Years
Fair Value SEK 438.80|37.1% undervalued
UN
Community Contributor