A Sliding Share Price Has Us Looking At Royal Unibrew A/S's (CPH:RBREW) P/E Ratio

Unfortunately for some shareholders, the Royal Unibrew (CPH:RBREW) share price has dived 47% in the last thirty days. The recent drop has obliterated the annual return, with the share price now down 26% over that longer period.
Assuming nothing else has changed, a lower share price makes a stock more attractive to potential buyers. In the long term, share prices tend to follow earnings per share, but in the short term prices bounce around in response to short term factors (which are not always obvious). The implication here is that long term investors have an opportunity when expectations of a company are too low. Perhaps the simplest way to get a read on investors' expectations of a business is to look at its Price to Earnings Ratio (PE Ratio). Investors have optimistic expectations of companies with higher P/E ratios, compared to companies with lower P/E ratios.
See our latest analysis for Royal Unibrew
Does Royal Unibrew Have A Relatively High Or Low P/E For Its Industry?
Royal Unibrew has a P/E ratio of 15.56. The image below shows that Royal Unibrew has a P/E ratio that is roughly in line with the beverage industry average (15.4).
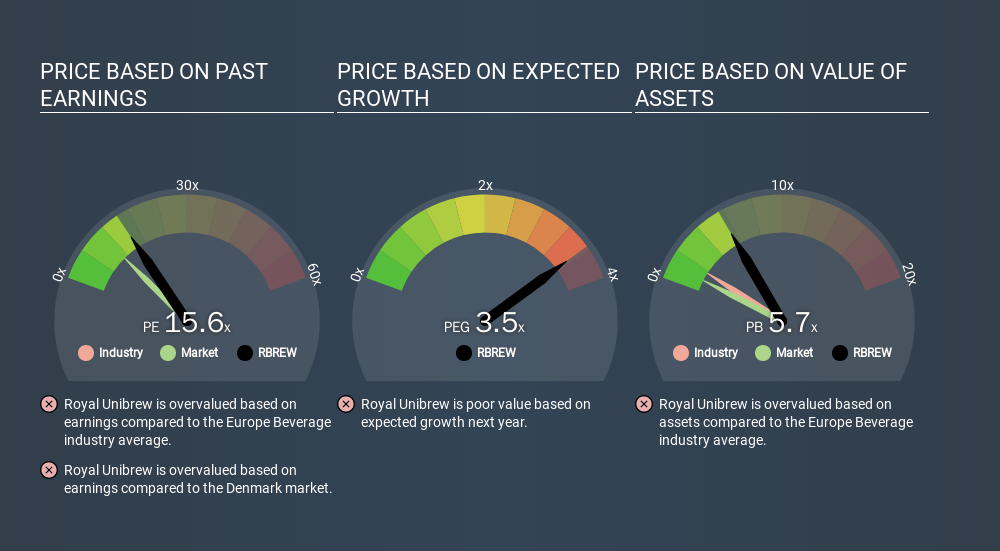
That indicates that the market expects Royal Unibrew will perform roughly in line with other companies in its industry. So if Royal Unibrew actually outperforms its peers going forward, that should be a positive for the share price. I would further inform my view by checking insider buying and selling., among other things.
How Growth Rates Impact P/E Ratios
Earnings growth rates have a big influence on P/E ratios. Earnings growth means that in the future the 'E' will be higher. Therefore, even if you pay a high multiple of earnings now, that multiple will become lower in the future. Then, a lower P/E should attract more buyers, pushing the share price up.
Most would be impressed by Royal Unibrew earnings growth of 12% in the last year. And its annual EPS growth rate over 5 years is 15%. This could arguably justify a relatively high P/E ratio.
Remember: P/E Ratios Don't Consider The Balance Sheet
One drawback of using a P/E ratio is that it considers market capitalization, but not the balance sheet. So it won't reflect the advantage of cash, or disadvantage of debt. Hypothetically, a company could reduce its future P/E ratio by spending its cash (or taking on debt) to achieve higher earnings.
Spending on growth might be good or bad a few years later, but the point is that the P/E ratio does not account for the option (or lack thereof).
How Does Royal Unibrew's Debt Impact Its P/E Ratio?
Royal Unibrew's net debt is 14% of its market cap. It would probably deserve a higher P/E ratio if it was net cash, since it would have more options for growth.
The Verdict On Royal Unibrew's P/E Ratio
Royal Unibrew's P/E is 15.6 which is above average (11.0) in its market. The company is not overly constrained by its modest debt levels, and its recent EPS growth very solid. So on this analysis it seems reasonable that its P/E ratio is above average. Given Royal Unibrew's P/E ratio has declined from 29.4 to 15.6 in the last month, we know for sure that the market is significantly less confident about the business today, than it was back then. For those who prefer to invest with the flow of momentum, that might be a bad sign, but for a contrarian, it may signal opportunity.
When the market is wrong about a stock, it gives savvy investors an opportunity. As value investor Benjamin Graham famously said, 'In the short run, the market is a voting machine but in the long run, it is a weighing machine. So this free visual report on analyst forecasts could hold the key to an excellent investment decision.
Of course, you might find a fantastic investment by looking at a few good candidates. So take a peek at this free list of companies with modest (or no) debt, trading on a P/E below 20.
If you spot an error that warrants correction, please contact the editor at editorial-team@simplywallst.com. This article by Simply Wall St is general in nature. It does not constitute a recommendation to buy or sell any stock, and does not take account of your objectives, or your financial situation. Simply Wall St has no position in the stocks mentioned.
We aim to bring you long-term focused research analysis driven by fundamental data. Note that our analysis may not factor in the latest price-sensitive company announcements or qualitative material. Thank you for reading.
About CPSE:RBREW
Royal Unibrew
Provides beer, soft drinks, malt beverages, energy drinks, cider/ready to drink, juice, water, and wine and spirits.
Solid track record average dividend payer.
Similar Companies
Market Insights

Community Narratives

