Advertisement
- United States
- /
- Software
- /
- OTCPK:EBIX.Q
A Rising Share Price Has Us Looking Closely At Ebix, Inc.'s (NASDAQ:EBIX) P/E Ratio
Ebix (NASDAQ:EBIX) shares have had a really impressive month, gaining 30%, after some slippage. But shareholders may not all be feeling jubilant, since the share price is still down 42% in the last year.
All else being equal, a sharp share price increase should make a stock less attractive to potential investors. In the long term, share prices tend to follow earnings per share, but in the short term prices bounce around in response to short term factors (which are not always obvious). So some would prefer to hold off buying when there is a lot of optimism towards a stock. Perhaps the simplest way to get a read on investors' expectations of a business is to look at its Price to Earnings Ratio (PE Ratio). A high P/E implies that investors have high expectations of what a company can achieve compared to a company with a low P/E ratio.
Check out our latest analysis for Ebix
How Does Ebix's P/E Ratio Compare To Its Peers?
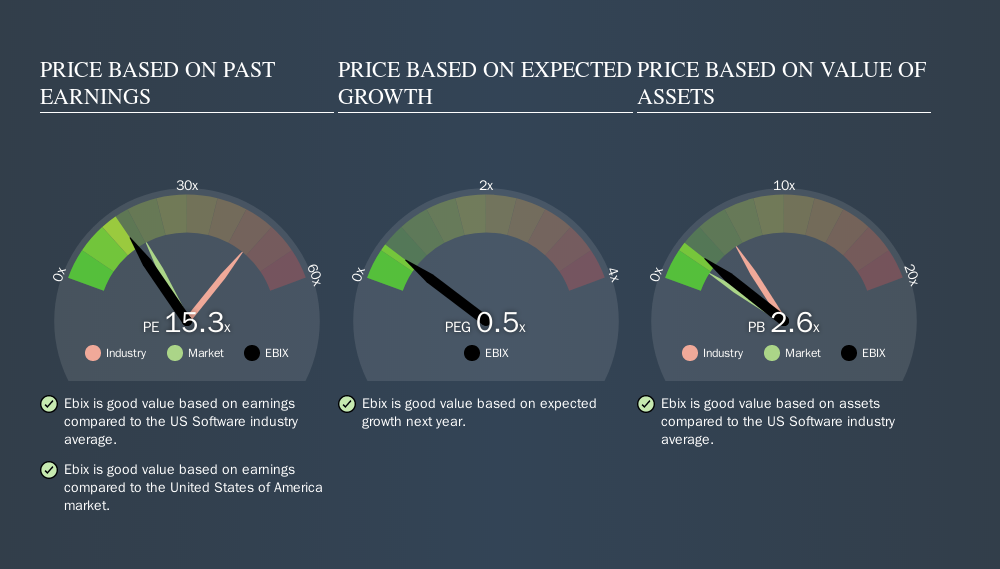
We can tell from its P/E ratio of 15.29 that sentiment around Ebix isn't particularly high. The image below shows that Ebix has a lower P/E than the average (47.5) P/E for companies in the software industry.
Its relatively low P/E ratio indicates that Ebix shareholders think it will struggle to do as well as other companies in its industry classification. Many investors like to buy stocks when the market is pessimistic about their prospects. You should delve deeper. I like to check if company insiders have been buying or selling.
How Growth Rates Impact P/E Ratios
Probably the most important factor in determining what P/E a company trades on is the earnings growth. Earnings growth means that in the future the 'E' will be higher. And in that case, the P/E ratio itself will drop rather quickly. Then, a lower P/E should attract more buyers, pushing the share price up.
Ebix saw earnings per share decrease by 11% last year. But EPS is up 15% over the last 5 years.
Don't Forget: The P/E Does Not Account For Debt or Bank Deposits
It's important to note that the P/E ratio considers the market capitalization, not the enterprise value. Thus, the metric does not reflect cash or debt held by the company. In theory, a company can lower its future P/E ratio by using cash or debt to invest in growth.
Such spending might be good or bad, overall, but the key point here is that you need to look at debt to understand the P/E ratio in context.
So What Does Ebix's Balance Sheet Tell Us?
Net debt is 49% of Ebix's market cap. You'd want to be aware of this fact, but it doesn't bother us.
The Bottom Line On Ebix's P/E Ratio
Ebix trades on a P/E ratio of 15.3, which is below the US market average of 18.2. With only modest debt, it's likely the lack of EPS growth at least partially explains the pessimism implied by the P/E ratio. What we know for sure is that investors have become more excited about Ebix recently, since they have pushed its P/E ratio from 11.7 to 15.3 over the last month. If you like to buy stocks that have recently impressed the market, then this one might be a candidate; but if you prefer to invest when there is 'blood in the streets', then you may feel the opportunity has passed.
When the market is wrong about a stock, it gives savvy investors an opportunity. If it is underestimating a company, investors can make money by buying and holding the shares until the market corrects itself. So this free report on the analyst consensus forecasts could help you make a master move on this stock.
You might be able to find a better buy than Ebix. If you want a selection of possible winners, check out this free list of interesting companies that trade on a P/E below 20 (but have proven they can grow earnings).
We aim to bring you long-term focused research analysis driven by fundamental data. Note that our analysis may not factor in the latest price-sensitive company announcements or qualitative material.
If you spot an error that warrants correction, please contact the editor at editorial-team@simplywallst.com. This article by Simply Wall St is general in nature. It does not constitute a recommendation to buy or sell any stock, and does not take account of your objectives, or your financial situation. Simply Wall St has no position in the stocks mentioned. Thank you for reading.
About OTCPK:EBIX.Q
Ebix
Provides on-demand infrastructure software exchanges and e-commerce services to the insurance, financial, travel, cash remittance, and healthcare industries in the United States and internationally.
Medium-low and good value.
Similar Companies
Market Insights


Advertisement
Weekly Picks
CE


Ceazar on Sparc AI ·
When GPS fails: this small cap is fixing a $54B drone problem
Fair Value:US$3.8756.3% undervalued
12 followersusers have followed this narrative
0 commentsusers have commented on this narrative
3 likesusers have liked this narrative
BL


BlackGoat on IREN ·
IREN's Bold Moves in Sustainable Bitcoin Mining & AI Data Centers
Fair Value:US$71.4852.5% undervalued
211 followersusers have followed this narrative
6 commentsusers have commented on this narrative
32 likesusers have liked this narrative
HE


HedgeY on Arm Holdings ·
The Architecture Layer of AI Computing - But Priced Like the Future Already Arrived?
Fair Value:US$43043.1% undervalued
13 followersusers have followed this narrative
1 commentusers have commented on this narrative
3 likesusers have liked this narrative
HI


Hidden_Rock_Capital on Fiserv ·
Temporary "perfect storm" leads to opportunity to buy financial services leader for less than 5x long-term earnings
Fair Value:US$119.9954.8% undervalued
20 followersusers have followed this narrative
0 commentsusers have commented on this narrative
8 likesusers have liked this narrative
Recently Updated Narratives
ON

Ontological on Robo.ai ·
Robo.ai and Abu Dhabi Enterprise Jointly Establish AI Industrial Group Alif Holding to Serve Infrastructure, Government and Industrial Secto
Fair Value:US$0.0026117.2k% overvalued
1 followerusers have followed this narrative
0 commentsusers have commented on this narrative
0 likesusers have liked this narrative
ON

Ontological on Lotus Technology ·
Lotus Tech, Finloop and FOMO Pay Collaborate to Explore Vehicle Tokenization
Fair Value:US$2.462.9% undervalued
1 followerusers have followed this narrative
2 commentsusers have commented on this narrative
0 likesusers have liked this narrative
NE
newsfinder11221 on Robo.ai ·
Robo.ai (NASDAQ: AIIO): Building the Infrastructure Behind the AI Revolution
Fair Value:US$539.0% undervalued
1 followerusers have followed this narrative
4 commentsusers have commented on this narrative
0 likesusers have liked this narrative
Popular Narratives
CU

CubanEros on Microsoft ·
A wonderful business at reasonable price.
Fair Value:US$419.916.3% undervalued
90 followersusers have followed this narrative
0 commentsusers have commented on this narrative
6 likesusers have liked this narrative
OS


oscargarcia on NVIDIA ·
The company that went from selling GPUs to gamers to becoming the AI arms dealer of the 21st century.
Fair Value:US$28029.6% undervalued
202 followersusers have followed this narrative
9 commentsusers have commented on this narrative
15 likesusers have liked this narrative
BE

benjamin_lvieq on PayPal Holdings ·
PayPal: PayPal Doesn't Need to Grow – It Needs to Stop Falling – A Mispriced Cash Machine With a Cannibal Buyback
Fair Value:US$6510.3% undervalued
73 followersusers have followed this narrative
2 commentsusers have commented on this narrative
11 likesusers have liked this narrative
Trending Discussion
BL

Blegells on Terra Balcanica Resources ·
⏫42X THE AVERAGE DAILY TRADING VOLUME TODAY, JULY 28 🐂🐂🐂 FORTY-TWO!
1
|0
DE

derek_3wsdg on Teladoc Health ·
You’ve overlooked the activist investor factor. Travis Cocke’s Voss has announced 5% ownership through a 13G filing. They’ve added to that 5% since, and in doing so, have created a structural trap door for 27.42 Million Shares actively sold short. Chuck will announce lots of positives on July 29 but it’s what Voss announces shortly after that will rock the overextended Teledoc shorts. The Walmart partnership is the tip of the iceberg. The market is missing the sheer regulatory and enterprise friction of modern corporate healthcare. Teladoc isn't a "consumer app"; it is the primary digital infrastructure integrated directly into the legacy backends of Tier-1 insurance companies and fortune 500 employers, covering 105 million+ lives. Teladoc is acting as the digital top-of-funnel engine for the world's largest retailer. If Voss pushes the narrative that Teladoc is effectively the outsourced digital brain of Walmart's entire healthcare footprint, the fair value shifts from a basic health multiple to an enterprise distribution premium. Additionally , we are in a structural gold rush for high-quality, legally compliant, longitudinal medical data to train vertical healthcare AI models. Large technology hyperscalers and pharmaceutical giants cannot simply scrape the internet for this; they need structured clinical inputs. Teladoc sits on one of the largest de-identified virtual medical datasets on earth. From the activist playbook , we’ll see Voss demand the immediate creation of a Data & Diagnostics Licensing Division, transforming a legacy liability into an incredibly high-margin, pure-software data asset that requires zero human clinician hours to scale. Chuck is doing great work and deserves credi5 for the Teledoc turnaround but it will be Travis Cocke who will be responsible for a share price way beyond your $15 valuation.
1
|0