
While not a mind-blowing move, it is good to see that the DCM Limited (NSE:DCM) share price has gained 14% in the last three months. But that doesn't help the fact that the three year return is less impressive. After all, the share price is down 83% in the last three years, significantly under-performing the market.
While a drop like that is definitely a body blow, money isn't as important as health and happiness.
View our latest analysis for DCM
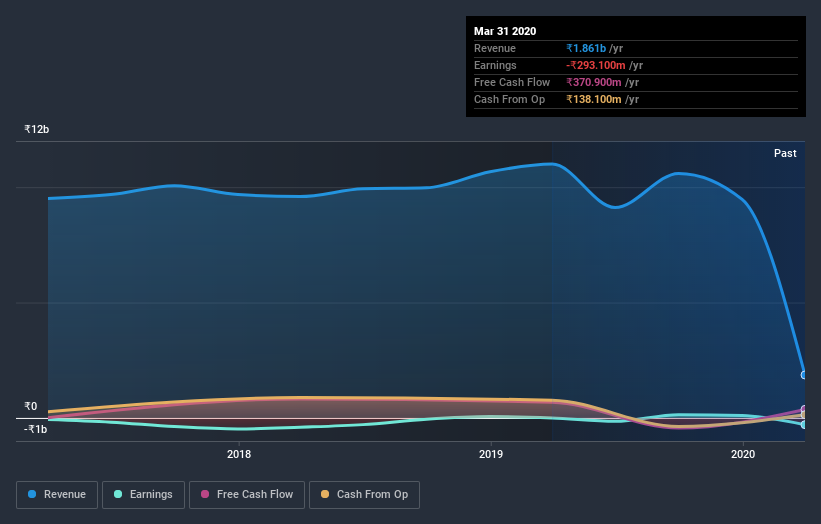
Because DCM made a loss in the last twelve months, we think the market is probably more focussed on revenue and revenue growth, at least for now. When a company doesn't make profits, we'd generally expect to see good revenue growth. That's because it's hard to be confident a company will be sustainable if revenue growth is negligible, and it never makes a profit.
In the last three years DCM saw its revenue shrink by 10% per year. That is not a good result. The share price fall of 22% (per year, over three years) is a stern reminder that money-losing companies are expected to grow revenue. This business clearly needs to grow revenues if it is to perform as investors hope. There's no more than a snowball's chance in hell that share price will head back to its old highs, in the short term.
You can see how earnings and revenue have changed over time in the image below (click on the chart to see the exact values).
It's probably worth noting that the CEO is paid less than the median at similar sized companies. But while CEO remuneration is always worth checking, the really important question is whether the company can grow earnings going forward. Before buying or selling a stock, we always recommend a close examination of historic growth trends, available here..
What about the Total Shareholder Return (TSR)?
Investors should note that there's a difference between DCM's total shareholder return (TSR) and its share price change, which we've covered above. The TSR is a return calculation that accounts for the value of cash dividends (assuming that any dividend received was reinvested) and the calculated value of any discounted capital raisings and spin-offs. Dividends have been really beneficial for DCM shareholders, and that cash payout explains why its total shareholder loss of 47%, over the last 3 years, isn't as bad as the share price return.
A Different Perspective
While the broader market gained around 5.2% in the last year, DCM shareholders lost 6.9%. Even the share prices of good stocks drop sometimes, but we want to see improvements in the fundamental metrics of a business, before getting too interested. However, the loss over the last year isn't as bad as the 5.8% per annum loss investors have suffered over the last half decade. We would want clear information suggesting the company will grow, before taking the view that the share price will stabilize. It's always interesting to track share price performance over the longer term. But to understand DCM better, we need to consider many other factors. Consider for instance, the ever-present spectre of investment risk. We've identified 2 warning signs with DCM , and understanding them should be part of your investment process.
If you are like me, then you will not want to miss this free list of growing companies that insiders are buying.
Please note, the market returns quoted in this article reflect the market weighted average returns of stocks that currently trade on IN exchanges.
When trading DCM or any other investment, use the platform considered by many to be the Professional's Gateway to the Worlds Market, Interactive Brokers. You get the lowest-cost* trading on stocks, options, futures, forex, bonds and funds worldwide from a single integrated account. Promoted
The New Payments ETF Is Live on NASDAQ:
Money is moving to real-time rails, and a newly listed ETF now gives investors direct exposure. Fast settlement. Institutional custody. Simple access.
Explore how this launch could reshape portfolios
Sponsored ContentNew: Manage All Your Stock Portfolios in One Place
We've created the ultimate portfolio companion for stock investors, and it's free.
• Connect an unlimited number of Portfolios and see your total in one currency
• Be alerted to new Warning Signs or Risks via email or mobile
• Track the Fair Value of your stocks
This article by Simply Wall St is general in nature. It does not constitute a recommendation to buy or sell any stock, and does not take account of your objectives, or your financial situation. We aim to bring you long-term focused analysis driven by fundamental data. Note that our analysis may not factor in the latest price-sensitive company announcements or qualitative material. Simply Wall St has no position in any stocks mentioned.
*Interactive Brokers Rated Lowest Cost Broker by StockBrokers.com Annual Online Review 2020
Have feedback on this article? Concerned about the content? Get in touch with us directly. Alternatively, email editorial-team@simplywallst.com.
About NSEI:DCM
Solid track record with excellent balance sheet.
Market Insights

Weekly Picks

THE KINGDOM OF BROWN GOODS: WHY MGPI IS BEING CRUSHED BY INVENTORY & PRIMED FOR RESURRECTION


Why Vertical Aerospace (NYSE: EVTL) is Worth Possibly Over 13x its Current Price


The Quiet Giant That Became AI’s Power Grid
Recently Updated Narratives

Butler National (Buks) outperforms.


A tech powerhouse quietly powering the world’s AI infrastructure.


Keppel DC REIT (SGX: AJBU) is a resilient gem in the data center space.
Popular Narratives

MicroVision will explode future revenue by 380.37% with a vision towards success


Crazy Undervalued 42 Baggers Silver Play (Active & Running Mine)


