
Advertisement
A Close Look At Intense Technologies Limited’s (NSE:INTENTECH) 20% ROCE

Today we are going to look at Intense Technologies Limited (NSE:INTENTECH) to see whether it might be an attractive investment prospect. Specifically, we're going to calculate its Return On Capital Employed (ROCE), in the hopes of getting some insight into the business.
First of all, we'll work out how to calculate ROCE. Then we'll compare its ROCE to similar companies. Last but not least, we'll look at what impact its current liabilities have on its ROCE.
Return On Capital Employed (ROCE): What is it?
ROCE measures the amount of pre-tax profits a company can generate from the capital employed in its business. In general, businesses with a higher ROCE are usually better quality. Overall, it is a valuable metric that has its flaws. Renowned investment researcher Michael Mauboussin has suggested that a high ROCE can indicate that 'one dollar invested in the company generates value of more than one dollar'.
So, How Do We Calculate ROCE?
Analysts use this formula to calculate return on capital employed:
Return on Capital Employed = Earnings Before Interest and Tax (EBIT) ÷ (Total Assets - Current Liabilities)
Or for Intense Technologies:
0.20 = ₹110m ÷ (₹591m - ₹40m) (Based on the trailing twelve months to September 2019.)
Therefore, Intense Technologies has an ROCE of 20%.
Check out our latest analysis for Intense Technologies
Does Intense Technologies Have A Good ROCE?
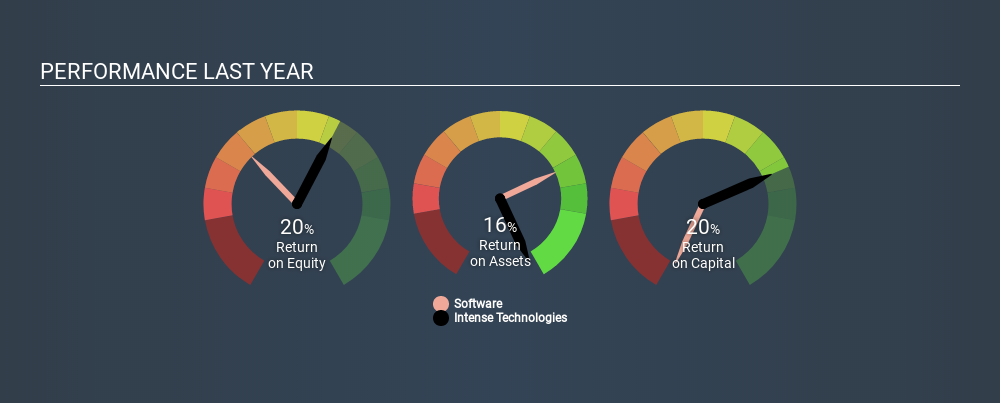
ROCE is commonly used for comparing the performance of similar businesses. Using our data, we find that Intense Technologies's ROCE is meaningfully better than the 9.5% average in the Software industry. We consider this a positive sign, because it suggests it uses capital more efficiently than similar companies. Separate from Intense Technologies's performance relative to its industry, its ROCE in absolute terms looks satisfactory, and it may be worth researching in more depth.
Intense Technologies delivered an ROCE of 20%, which is better than 3 years ago, as was making losses back then. This makes us wonder if the company is improving. You can click on the image below to see (in greater detail) how Intense Technologies's past growth compares to other companies.
It is important to remember that ROCE shows past performance, and is not necessarily predictive. ROCE can be deceptive for cyclical businesses, as returns can look incredible in boom times, and terribly low in downturns. ROCE is, after all, simply a snap shot of a single year. How cyclical is Intense Technologies? You can see for yourself by looking at this free graph of past earnings, revenue and cash flow.
Do Intense Technologies's Current Liabilities Skew Its ROCE?
Liabilities, such as supplier bills and bank overdrafts, are referred to as current liabilities if they need to be paid within 12 months. Due to the way the ROCE equation works, having large bills due in the near term can make it look as though a company has less capital employed, and thus a higher ROCE than usual. To counteract this, we check if a company has high current liabilities, relative to its total assets.
Intense Technologies has total liabilities of ₹40m and total assets of ₹591m. Therefore its current liabilities are equivalent to approximately 6.8% of its total assets. In addition to low current liabilities (making a negligible impact on ROCE), Intense Technologies earns a sound return on capital employed.
Our Take On Intense Technologies's ROCE
This is good to see, and while better prospects may exist, Intense Technologies seems worth researching further. Intense Technologies shapes up well under this analysis, but it is far from the only business delivering excellent numbers . You might also want to check this free collection of companies delivering excellent earnings growth.
If you like to buy stocks alongside management, then you might just love this free list of companies. (Hint: insiders have been buying them).
If you spot an error that warrants correction, please contact the editor at editorial-team@simplywallst.com. This article by Simply Wall St is general in nature. It does not constitute a recommendation to buy or sell any stock, and does not take account of your objectives, or your financial situation. Simply Wall St has no position in the stocks mentioned.
We aim to bring you long-term focused research analysis driven by fundamental data. Note that our analysis may not factor in the latest price-sensitive company announcements or qualitative material. Thank you for reading.
About NSEI:INTENTECH
Intense Technologies
Provides enterprise platform and IP-enabled service organization services in India.
Flawless balance sheet slight.
Market Insights


Advertisement
Community Narratives
The Future of Drug Testing? Fingerprint Tech Shows Serious Promise
Fair Value US$2.98|40.3% undervalued
JO
Community Contributor
Suncorp’s Next Chapter: Insurance-Only and Ready to Grow
Fair Value AU$22.83|7.9% undervalued
RO
Community Contributor
Thyssenkrupp Nucera Will Achieve Double-Digit Profits by 2030 Boosted by Hydrogen Growth
Fair Value €14.40|31.6% undervalued
CH
Community Contributor
Tesla’s Nvidia Moment – The AI & Robotics Inflection Point
Fair Value US$359.72|12.3% undervalued
BL
Community Contributor