

Last Update 16 Jun 26
Fair value Decreased 9.70%AMA: Share Buyback And Margin Outlook Will Support Future Upside
Analysts have trimmed their fair value estimate for AMA Group from A$1.11 to A$1.00, reflecting updated assumptions around a slightly lower discount rate, more moderate revenue growth, a small uplift in profit margin, and a lower future P/E multiple.
What's in the News
- AMA Group's board authorized a buyback plan on May 8, 2026, according to a key developments update.
- The company announced a share repurchase program under which it may buy back up to 47,826,141 shares, representing 9.93% of issued share capital, based on 481,483,688 outstanding shares as of May 8, 2026.
- The buyback authorization and repurchase program are stated to run through May 24, 2027, according to the key developments source.
Valuation Changes
- Fair Value: Trimmed from A$1.11 to A$1.00, indicating a modest reduction in the assessed valuation per share.
- Discount Rate: Adjusted slightly lower from 9.03% to 8.79%, reflecting a small change in the required return used in the model.
- Revenue Growth: Assumed annual revenue growth reduced from about 4.83% to 3.80%, indicating more moderate expectations.
- Net Profit Margin: Increased from roughly 3.17% to 3.24%, indicating a small uplift in expected profitability.
- Future P/E: Forward P/E assumption reduced from 18.01x to 16.31x, indicating a more conservative multiple applied to future earnings.
Key Takeaways
- Focus on complex repairs, in-house calibrations, and specialized B2B agreements is driving higher margins, revenue growth, and predictable earnings amid vehicle technology trends.
- Continued efficiency gains, sector consolidation, and diversification into adjacent markets enhance resilience, growth opportunities, and reduce market concentration risk.
- Declining repair volumes, rising operational complexity, and strategic uncertainty in non-core divisions threaten growth, margins, and financial flexibility amid ongoing high capital expenditure needs.
Catalysts
About AMA Group- Engages in the development and operation of collision repair business in Australia and New Zealand.
- The increasing complexity of new vehicles and wider adoption of ADAS is driving up the severity and complexity of repairs. AMA Group is capturing higher average revenue per job through its focus on in-house calibrations (e.g., TechRight business expansion), extended repair scopes, and ability to service higher-end, technology-laden vehicles; this is expected to deliver further revenue and margin growth as the car parc continues to evolve.
- The shift toward large, repeat B2B customers (major insurers and fleets) is deepening, evidenced by improved and repriced long-term agreements (Suncorp, transport fleets) and rising demand for specialized, high-capacity repair solutions. AMA's growing national scale and optimized network are likely to drive both revenue predictability and margin resilience.
- AMA's ongoing operational efficiency, site/network optimization, and technology-driven workflow integration have begun to deliver meaningful margin expansion (core EBITDA margin up to 6.9%, with a medium-term target of 10%). These programs are expected to compound benefits for net margins and cash generation as volumes stabilize and the business cycles out of catch-up capex.
- Sector consolidation remains robust, positioning AMA as a leading multi-site operator. Recent refinancing and strengthened balance sheet (through equity raising and debt reduction) provides AMA with financial flexibility to pursue further organic and acquisition-driven growth-enhancing revenue, EBIT and reinforcing negotiating power with suppliers/insurers.
- Diversification into adjacent verticals (heavy vehicles, mechanical/parts with Wales and ACM Parts businesses), combined with growth in value-added adjacencies (e.g., calibration, consumables), should broaden AMA's addressable market and reduce concentration risk. This is expected to support more stable top-line and earnings growth through sector cycles.
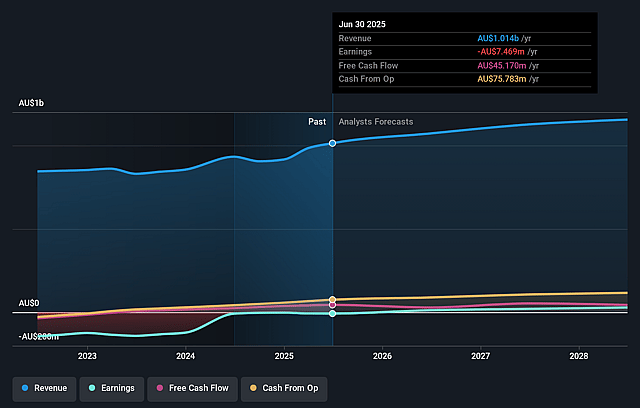
AMA Group Future Earnings and Revenue Growth
Assumptions
How have these above catalysts been quantified?
- Analysts are assuming AMA Group's revenue will grow by 3.8% annually over the next 3 years.
- Analysts assume that profit margins will increase from -0.4% today to 3.2% in 3 years time.
- Analysts expect earnings to reach A$37.8 million (and earnings per share of A$0.05) by about June 2029, up from -A$4.1 million today.
- In order for the above numbers to justify the price target of the analysts, the company would need to trade at a PE ratio of 16.3x on those 2029 earnings, up from -56.1x today. This future PE is lower than the current PE for the AU Commercial Services industry at 31.6x.
- Analysts expect the number of shares outstanding to grow by 0.07% per year for the next 3 years.
- To value all of this in today's terms, we will use a discount rate of 8.79%, as per the Simply Wall St company report.
Risks
What could happen that would invalidate this narrative?- Management flagged declining vehicle repair volumes in some metro areas, with lower claim frequency for minor work driven by cost-of-living pressures and broader market changes-posing a risk of stagnant or shrinking revenues even as severity per job rises.
- The company recognizes that in the Capital SMART division, revenue growth is not expected to keep pace with previous years due to ongoing contraction in vehicle repair volumes in key markets, limiting future earnings expansion and margin growth.
- The increasing complexity and diversity of vehicle technology, especially with rapid changes in car park mix and more brands/OEMs, is making it more difficult to insource calibrations and keep up with repair requirements, potentially driving up operational costs and reducing net margins if scale and technical expertise cannot match industry evolution.
- ACM Parts remains a strategic uncertainty, with management indicating they do not believe AMA is the "rightful owner," creating potential for costly asset sales, underperformance, or internal distraction, impairing net profit and financial flexibility.
- Ongoing capital expenditure "catch-up" programs, which are expected to peak in FY26, keep cash requirements and risk of future maintenance spend high, raising potential for margin and free cash flow pressure if operational improvements do not offset these elevated costs.
Valuation
How have all the factors above been brought together to estimate a fair value?
- The analysts have a consensus price target of A$1.0 for AMA Group based on their expectations of its future earnings growth, profit margins and other risk factors.
- However, there is a degree of disagreement amongst analysts, with the most bullish reporting a price target of A$1.2, and the most bearish reporting a price target of just A$0.8.
- In order for you to agree with the analysts, you'd need to believe that by 2029, revenues will be A$1.2 billion, earnings will come to A$37.8 million, and it would be trading on a PE ratio of 16.3x, assuming you use a discount rate of 8.8%.
- Given the current share price of A$0.47, the analyst price target of A$1.0 is 52.5% higher.
- We always encourage you to reach your own conclusions though. So sense check these analyst numbers against your own assumptions and expectations based on your understanding of the business and what you believe is probable.
Have other thoughts on AMA Group?
Create your own narrative on this stock, and estimate its Fair Value using our Valuator tool.
Create NarrativeHow well do narratives help inform your perspective?
Disclaimer
AnalystConsensusTarget is a tool utilizing a Large Language Model (LLM) that ingests data on consensus price targets, forecasted revenue and earnings figures, as well as the transcripts of earnings calls to produce qualitative analysis. The narratives produced by AnalystConsensusTarget are general in nature and are based solely on analyst data and publicly-available material published by the respective companies. These scenarios are not indicative of the company's future performance and are exploratory in nature. Simply Wall St has no position in the company(s) mentioned. Simply Wall St may provide the securities issuer or related entities with website advertising services for a fee, on an arm's length basis. These relationships have no impact on the way we conduct our business, the content we host, or how our content is served to users. The price targets and estimates used are consensus data, and do not constitute a recommendation to buy or sell any stock, and they do not take account of your objectives, or your financial situation. Note that AnalystConsensusTarget's analysis may not factor in the latest price-sensitive company announcements or qualitative material.


