


Key Takeaways
- Structural industry trends, operational transformation, and advanced capabilities position AMA for above-market revenue growth, margin expansion, and sustained outperformance versus consensus expectations.
- Accelerated deleveraging and capital redeployment enable AMA to capture market share faster, with resilient demand and premium positioning driving long-term earnings strength.
- Declining accident rates, operational inefficiencies, high costs, and intensifying competition threaten AMA Group's repair volumes, margin stability, and long-term earnings quality.
Catalysts
About AMA Group- Engages in the development and operation of collision repair business in Australia and New Zealand.
- Analyst consensus projects steady performance improvements at Capital S.M.A.R.T, but this could be overly conservative as the updated Suncorp agreement's annual repricing mechanism and shift toward higher severity and complexity repairs are likely to further accelerate revenue growth and push EBITDA margins well above the expected 10 percent, exceeding analyst expectations on earnings and net margin expansion.
- While analysts broadly expect Project Wallaby and ongoing optimization in AMA Collision to deliver moderate upside, the pace and magnitude of operational transformation appear understated; with second-half EBITDA already dramatically outperforming the first half and full benefits from network optimization, capability uplift, and customer mix still to come, this division could deliver a step-change in recurring net margins and free cash flow generation.
- The combination of resilient demand drivers-specifically, the steady rise in average vehicle age and vehicle parc, and more complex, insurance-funded repairs due to increased ADAS penetration-positions AMA for compounding top-line revenue growth and gross margin uplift structurally ahead of GDP for the foreseeable future.
- The massive deleveraging and three-year refinancing at improved interest rates free up substantial capital for accelerated greenfield expansions and strategic site refurbishments, enabling AMA to take disproportionate market share as industry consolidation accelerates and to scale EBITDA materially faster than consensus models that forecast slower deployment.
- AMA's ongoing investment in in-house calibration (TechRight network), digital booking systems, and EV/ADAS training will increasingly establish AMA as the repairer of choice with insurers and customers, driving premium pricing, higher-margin work, and sustained market share gains, further deepening the company's earnings moat and top-line resilience in outyears.
AMA Group Future Earnings and Revenue Growth
Assumptions
How have these above catalysts been quantified?- This narrative explores a more optimistic perspective on AMA Group compared to the consensus, based on a Fair Value that aligns with the bullish cohort of analysts.
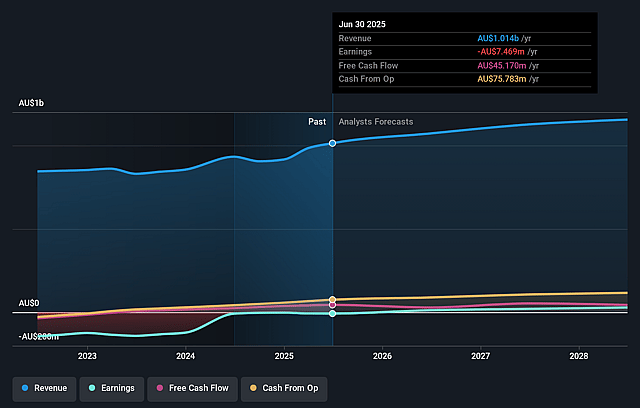
- The bullish analysts are assuming AMA Group's revenue will grow by 5.4% annually over the next 3 years.
- The bullish analysts assume that profit margins will increase from -0.7% today to 2.9% in 3 years time.
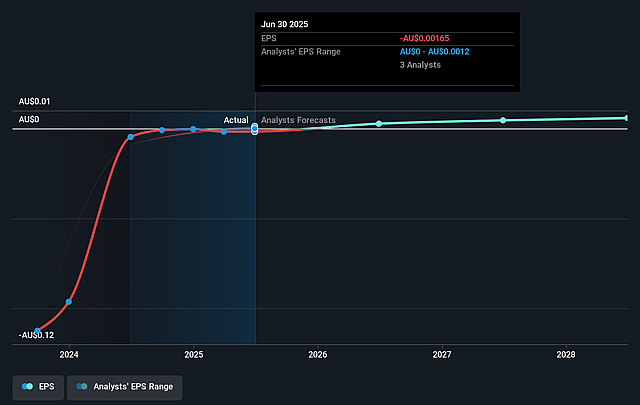
- The bullish analysts expect earnings to reach A$35.0 million (and earnings per share of A$0.01) by about September 2028, up from A$-7.5 million today. The analysts are largely in agreement about this estimate.
- In order for the above numbers to justify the price target of the more bullish analyst cohort, the company would need to trade at a PE ratio of 25.6x on those 2028 earnings, up from -60.9x today. This future PE is lower than the current PE for the AU Commercial Services industry at 33.9x.
- Analysts expect the number of shares outstanding to remain consistent over the next 3 years.
- To value all of this in today's terms, we will use a discount rate of 7.71%, as per the Simply Wall St company report.
AMA Group Future Earnings Per Share Growth
Risks
What could happen that would invalidate this narrative?- Secular declines in vehicle accident rates due to growth of electric vehicles and advanced driver-assistance systems are already resulting in lower repair volumes in metro areas, with management noting declining claim volumes for smaller work, likely reducing AMA Group's addressable collision repair revenues in the long run.
- Increased remote work and cost-of-living pressures are contributing to fewer vehicle claims and lower volumes in suburban and urban markets, challenging the company's ability to grow or even maintain repair volumes, which could weigh on both top-line revenue and earnings growth.
- AMA Group is experiencing ongoing integration and operational complexity in businesses such as Prestige and ACM Parts, areas that management acknowledges as needing further rationalization and rightsizing, indicating persistent difficulty achieving cost efficiency and consistent net margins group-wide.
- The company's capital expenditure remains elevated, with further "catch-up" spending required in fiscal year 2026 due to previous underinvestment, meaning ongoing pressure on free cash flow, and potentially limiting the ability to invest in new technologies or adapt to industry changes without risking margin compression.
- Rising competition from insurer-managed networks, vertical integration, and the technical complexity of modern vehicle repairs is putting upward pressure on labor and tooling costs, while also eroding the bargaining power of independent operators like AMA, leading to downward pressure on margins, revenue stability, and long-term earnings quality.
Valuation
How have all the factors above been brought together to estimate a fair value?- The assumed bullish price target for AMA Group is A$0.15, which is the highest price target estimate amongst analysts. This valuation is based on what can be assumed as the expectations of AMA Group's future earnings growth, profit margins and other risk factors from analysts on the bullish end of the spectrum.
- However, there is a degree of disagreement amongst analysts, with the most bullish reporting a price target of A$0.15, and the most bearish reporting a price target of just A$0.11.
- In order for you to agree with the bullish analysts, you'd need to believe that by 2028, revenues will be A$1.2 billion, earnings will come to A$35.0 million, and it would be trading on a PE ratio of 25.6x, assuming you use a discount rate of 7.7%.
- Given the current share price of A$0.1, the bullish analyst price target of A$0.15 is 36.7% higher.
- We always encourage you to reach your own conclusions though. So sense check these analyst numbers against your own assumptions and expectations based on your understanding of the business and what you believe is probable.
Have other thoughts on AMA Group?
Create your own narrative on this stock, and estimate its Fair Value using our Valuator tool.
Create NarrativeHow well do narratives help inform your perspective?
Disclaimer
AnalystHighTarget is a tool utilizing a Large Language Model (LLM) that ingests data on consensus price targets, forecasted revenue and earnings figures, as well as the transcripts of earnings calls to produce qualitative analysis. The narratives produced by AnalystHighTarget are general in nature and are based solely on analyst data and publicly-available material published by the respective companies. These scenarios are not indicative of the company's future performance and are exploratory in nature. Simply Wall St has no position in the company(s) mentioned. Simply Wall St may provide the securities issuer or related entities with website advertising services for a fee, on an arm's length basis. These relationships have no impact on the way we conduct our business, the content we host, or how our content is served to users. The price targets and estimates used are consensus data, and do not constitute a recommendation to buy or sell any stock, and they do not take account of your objectives, or your financial situation. Note that AnalystHighTarget's analysis may not factor in the latest price-sensitive company announcements or qualitative material.


