

Last Update 22 Jun 26
Fair value Decreased 4.56%IIIV: Share Repurchases And Trimmed Guidance Will Support Future Upside Potential
The analyst price target for i3 Verticals has been trimmed as the fair value estimate moves from $28.50 to $27.20. This reflects recent Street research where analysts cut their targets to $30 and pointed to slightly lower longer term guidance and valuation assumptions, including a reduced future P/E multiple.
Analyst Commentary
Recent Street research on i3 Verticals points to a more measured stance, with price targets adjusted to $30 and valuation frameworks reset, even as ratings stay constructive. For you as an investor, the focus is shifting toward how the company executes against refined guidance and how that feeds into future P/E assumptions.
Bullish Takeaways
- Bullish analysts continue to see value in i3 Verticals at current levels, as reflected in maintained positive ratings despite the lower $30 price targets.
- The modest 1% to 2% trimming of FY26 total revenue and adjusted EBITDA guidance midpoints is framed as manageable, with expectations that reduced non recurring professional services revenue is a temporary headwind.
- Valuation work from bullish analysts still supports a premium to current trading levels, even after incorporating a reduced future P/E multiple into their models.
- Ongoing coverage and updated targets suggest analysts remain engaged with the i3 Verticals story, which can help keep the stock on the radar of institutional investors.
Bearish Takeaways
- Bearish analysts highlight that the guidance trim for FY26 total revenue and adjusted EBITDA, even at 1% to 2%, signals a more cautious growth and profitability trajectory than previously expected.
- The cut in price targets from higher prior levels to $30 indicates reduced confidence in earlier valuation assumptions and a need for stronger execution to justify higher multiples.
- Expectations for lower non recurring professional services revenue in the near term raise questions about the mix of revenue and how quickly higher quality or more predictable streams can offset that pressure.
- The lowered future P/E multiple embedded in fair value work points to concern that investors may be less willing to pay as high a valuation for i3 Verticals without clearer visibility on long term earnings power.
What’s in the News for i3 Verticals
- i3 Verticals, Inc. announced a share repurchase program authorizing the company to buy back up to US$100 million of its Class A common stock. The program will expire on the earlier of May 11, 2027 or when the full authorization is used. (Source: Company buyback announcement)
- The Board of Directors of i3 Verticals authorized a new buyback plan on May 12, 2026, adding to the company’s use of repurchases as a capital allocation tool. (Source: Board buyback authorization)
- From February 5, 2026 to March 31, 2026, i3 Verticals repurchased 1,703,682 shares, described as 7.54% of shares, for US$38.3 million under the February 5, 2026 buyback authorization. (Source: Buyback tranche update)
- From April 1, 2026 to May 7, 2026, the company repurchased a further 992,058 shares, described as 4.83% of shares, for US$21.7 million. This brought total completed repurchases under the February 5, 2026 program to 2,695,740 shares, described as 12.36%, for US$60 million. (Source: Buyback tranche update)
- i3 Verticals revised fiscal 2026 revenue guidance to a range of US$221,000,000 to US$229,000,000, compared with previous guidance of US$223,000,000 to US$234,000,000. (Source: Corporate guidance update)
Valuation Changes for i3 Verticals
- Fair value was trimmed from $28.50 to $27.20, a reduction of about 4.6% in the updated model.
- The discount rate was adjusted slightly from 9.04% to 9.00%, representing a small refinement in the risk assumption applied to i3 Verticals.
- Revenue growth was revised marginally, with the forecast moving from 8.01% to 8.01%, indicating only a very small change in expected top line expansion for the company.
- The net profit margin assumption was updated from 5.51% to 5.67%, representing a modest uplift in the profitability expectation used in the valuation work.
- The future P/E multiple moved from 36.78x to 34.10x, reflecting a lower valuation multiple applied to i3 Verticals in the forward earnings framework.
Key Takeaways
- Strong demand for AI-powered public sector software and ongoing innovation drive revenue growth, customer retention, and improved margins through modernization and higher client wallet share.
- Focus on high-barrier government verticals and disciplined acquisitions ensures stable, recurring revenues and scalable growth with operational and financial flexibility.
- Growing focus on public sector software heightens exposure to revenue volatility, margin pressure, and competitive risks amid sector-specific uncertainties and evolving regulatory or technological landscapes.
Catalysts
About i3 Verticals- i3 Verticals, Inc. builds, acquires, and grows software solutions in the public sector and healthcare vertical markets in the United States and Canada.
- Increasing digitization initiatives among state and local governments are driving sustained demand for integrated public sector software solutions, as evidenced by double-digit revenue and SaaS growth for i3 Verticals, supporting continued organic revenue and ARR growth.
- i3 Verticals' deepening integration of AI and automation into its software products to modernize public sector operations (e.g., document analysis, support automation, development efficiency) both increases customer retention via higher switching costs and improves gross margins by boosting operational efficiency.
- A singular focus on high-barrier public sector verticals (education, utilities, transportation, justice/public safety) positions i3 Verticals to benefit from multi-year enterprise system upgrades and recurring, contractually escalated revenues, supporting both revenue visibility and expanding net margins.
- Ongoing product innovation and cross-selling of new modules (Justice Tech, transportation kiosks, utility ePortals, education platforms), alongside market expansion in new states, directly increase wallet share per client and drive top-line growth.
- A robust, debt-free balance sheet and large revolving credit facility enable disciplined pursuit of strategic "tuck-in" acquisitions-allowing for scalable, inorganic revenue and EBITDA growth while maintaining long-term earnings accretion.
i3 Verticals Future Earnings and Revenue Growth
Assumptions
How have these above catalysts been quantified?
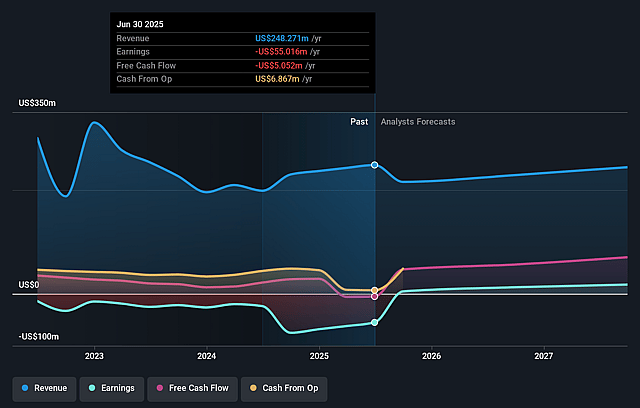
- Analysts are assuming i3 Verticals's revenue will grow by 8.0% annually over the next 3 years.
- Analysts assume that profit margins will increase from 1.3% today to 5.7% in 3 years time.
- Analysts expect earnings to reach $15.5 million (and earnings per share of $0.38) by about June 2029, up from $2.8 million today. However, there is some disagreement amongst the analysts with the more bearish ones expecting earnings as low as $13.9 million.
- In order for the above numbers to justify the price target of the analysts, the company would need to trade at a PE ratio of 35.7x on those 2029 earnings, down from 138.7x today. This future PE is greater than the current PE for the US Software industry at 25.9x.
- Analysts expect the number of shares outstanding to decline by 7.0% per year for the next 3 years.
- To value all of this in today's terms, we will use a discount rate of 9.0%, as per the Simply Wall St company report.
Risks
What could happen that would invalidate this narrative?- i3 Verticals' increasing concentration in the public sector-especially government, utilities, and education-exposes the company to sector-specific budget cycles, procurement delays, and potential political or regulatory shifts, which could introduce long-term revenue volatility and dampen top-line growth.
- The company's strategy to invest heavily in talent and product development ahead of anticipated revenue opportunities (particularly in Justice Tech) increases near-term cost structure; if projected growth does not materialize as expected, this could compress margins and negatively impact earnings.
- Reliance on recurring but sometimes variable software license and professional services sales, which are subject to quarter-to-quarter swings, introduces unpredictability in revenue streams and makes long-term financial planning and forecasting challenging-potentially leading to investor skepticism and lower valuation multiples.
- Rapid advancements in technology, ongoing commoditization of vertical SaaS markets, and increasing competition from larger tech firms or more agile fintechs could render i3 Verticals' solutions less competitive over time, risking customer attrition, slower ARR growth, and heightened pricing pressure that squeeze net margins.
- The shift to a pure-play public sector software model, while creating focus, reduces diversification and increases exposure to changes in public sector IT spending priorities or regulatory actions, potentially amplifying risks to both revenue stability and earnings resilience over the long term.
Valuation
How have all the factors above been brought together to estimate a fair value?
- The analysts have a consensus price target of $27.2 for i3 Verticals based on their expectations of its future earnings growth, profit margins and other risk factors.
- However, there is a degree of disagreement amongst analysts, with the most bullish reporting a price target of $30.0, and the most bearish reporting a price target of just $22.0.
- In order for you to agree with the analysts, you'd need to believe that by 2029, revenues will be $273.4 million, earnings will come to $15.5 million, and it would be trading on a PE ratio of 35.7x, assuming you use a discount rate of 9.0%.
- Given the current share price of $19.82, the analyst price target of $27.2 is 27.1% higher.
- We always encourage you to reach your own conclusions though. So sense check these analyst numbers against your own assumptions and expectations based on your understanding of the business and what you believe is probable.
Have other thoughts on i3 Verticals?
Create your own narrative on this stock, and estimate its Fair Value using our Valuator tool.
Create NarrativeHow well do narratives help inform your perspective?
Comments
0 commentsDisclaimer
AnalystConsensusTarget is a tool utilizing a Large Language Model (LLM) that ingests data on consensus price targets, forecasted revenue and earnings figures, as well as the transcripts of earnings calls to produce qualitative analysis. The narratives produced by AnalystConsensusTarget are general in nature and are based solely on analyst data and publicly-available material published by the respective companies. These scenarios are not indicative of the company's future performance and are exploratory in nature. Simply Wall St has no position in the company(s) mentioned. Simply Wall St may provide the securities issuer or related entities with website advertising services for a fee, on an arm's length basis. These relationships have no impact on the way we conduct our business, the content we host, or how our content is served to users. The price targets and estimates used are consensus data, and do not constitute a recommendation to buy or sell any stock, and they do not take account of your objectives, or your financial situation. Note that AnalystConsensusTarget's analysis may not factor in the latest price-sensitive company announcements or qualitative material.


