


Last Update07 May 25Fair value Increased 0.79%
Key Takeaways
- Expansion of global store base and online capabilities could drive significant revenue growth by increasing customer reach and engagement.
- Investment in infrastructure and a flexible business model supports operational efficiency and helps maintain strong net margins amid changing trends.
- Rising operational costs and external factors, like foreign exchange rates and real estate challenges, may pressure TJX Companies' margins and revenue potential.
Catalysts
About TJX Companies- Operates as an off-price apparel and home fashions retailer in the United States, Canada, Europe, and Australia.
- TJX Companies plans to increase its global store base, targeting a total of 7,000 stores, with significant growth potential in existing and announced geographies. This expansion is expected to drive revenue growth through increased physical presence and customer reach.
- The company emphasizes its flexible business model, allowing it to adapt quickly to changing macro trends and consumer preferences, potentially enhancing revenue and maintaining high net margins.
- Strong mark-on performance, driven by improved buying strategies and reduced shrink expenses, suggests an opportunity to improve gross margins further, thereby positively impacting net earnings.
- Continued focus on expanding its online treasure hunt shopping experience and adding new categories and brands could enhance customer engagement and lead to higher e-commerce sales, contributing to overall revenue growth.
- TJX's investments in its distribution network and infrastructure, along with plans to remodel and relocate stores, are aimed at improving operational efficiencies and could positively impact net margins by reducing costs over time.
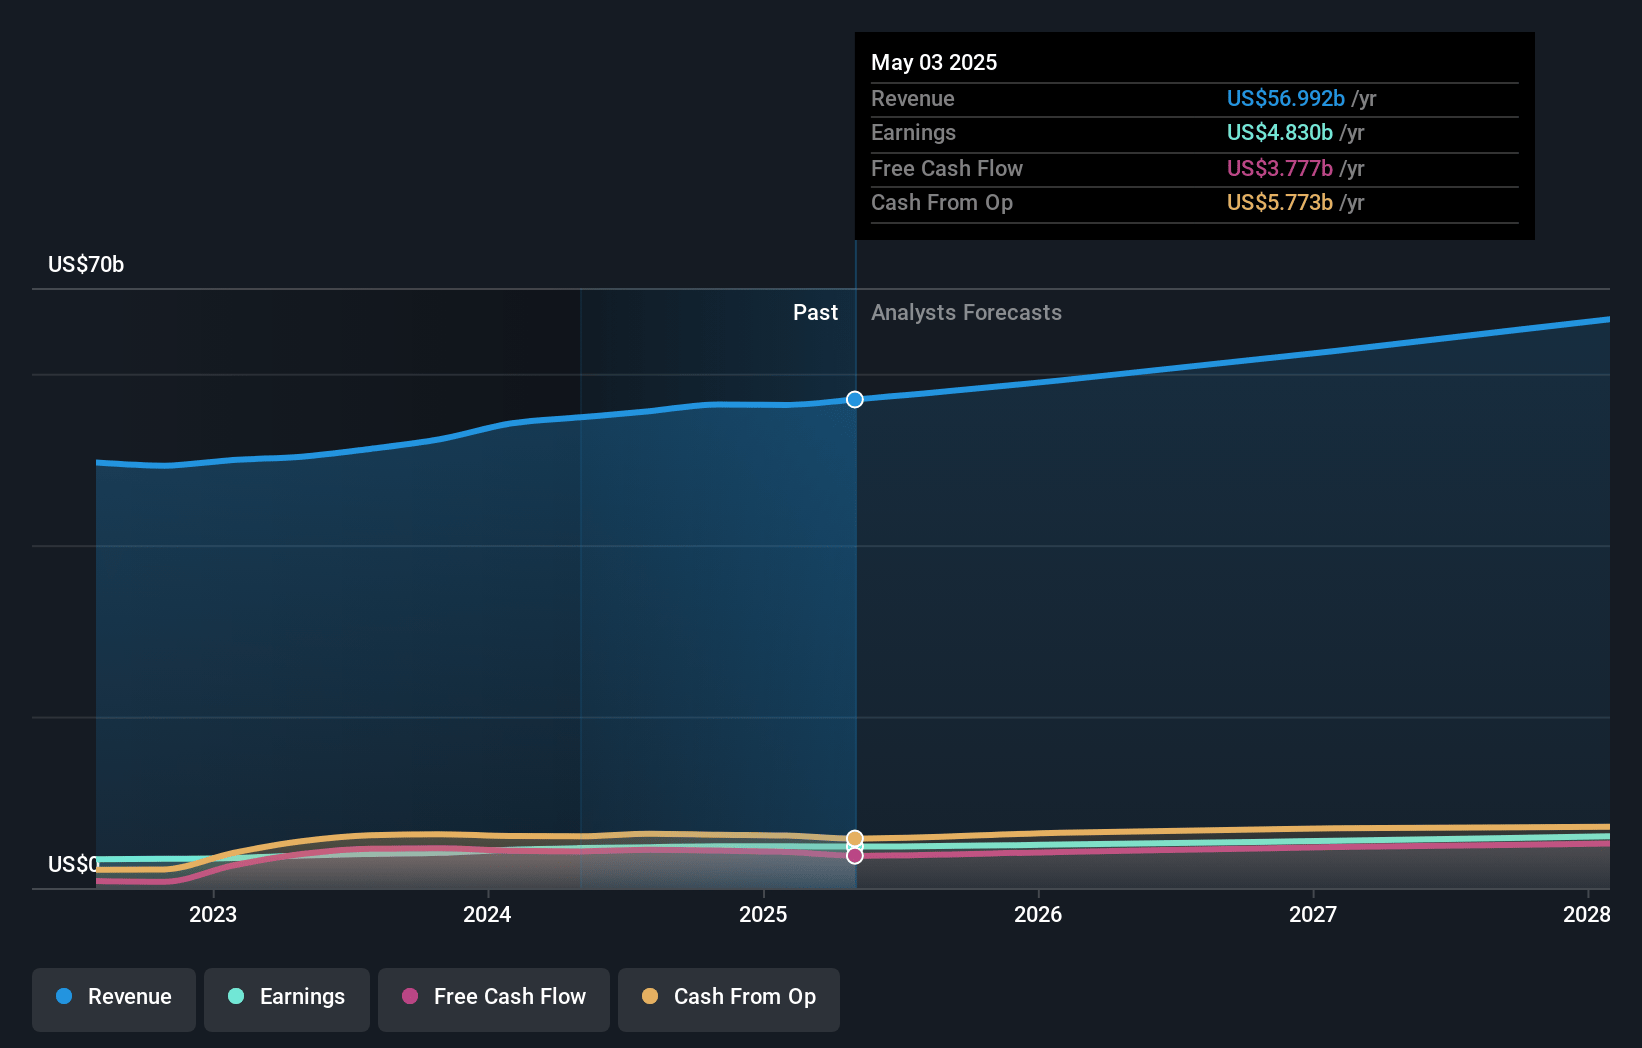
TJX Companies Future Earnings and Revenue Growth
Assumptions
How have these above catalysts been quantified?- Analysts are assuming TJX Companies's revenue will grow by 5.6% annually over the next 3 years.
- Analysts assume that profit margins will increase from 8.6% today to 9.3% in 3 years time.
- Analysts expect earnings to reach $6.2 billion (and earnings per share of $5.67) by about May 2028, up from $4.9 billion today. The analysts are largely in agreement about this estimate.
- In order for the above numbers to justify the analysts price target, the company would need to trade at a PE ratio of 29.3x on those 2028 earnings, down from 29.5x today. This future PE is greater than the current PE for the US Specialty Retail industry at 15.2x.
- Analysts expect the number of shares outstanding to decline by 1.15% per year for the next 3 years.
- To value all of this in today's terms, we will use a discount rate of 7.6%, as per the Simply Wall St company report.
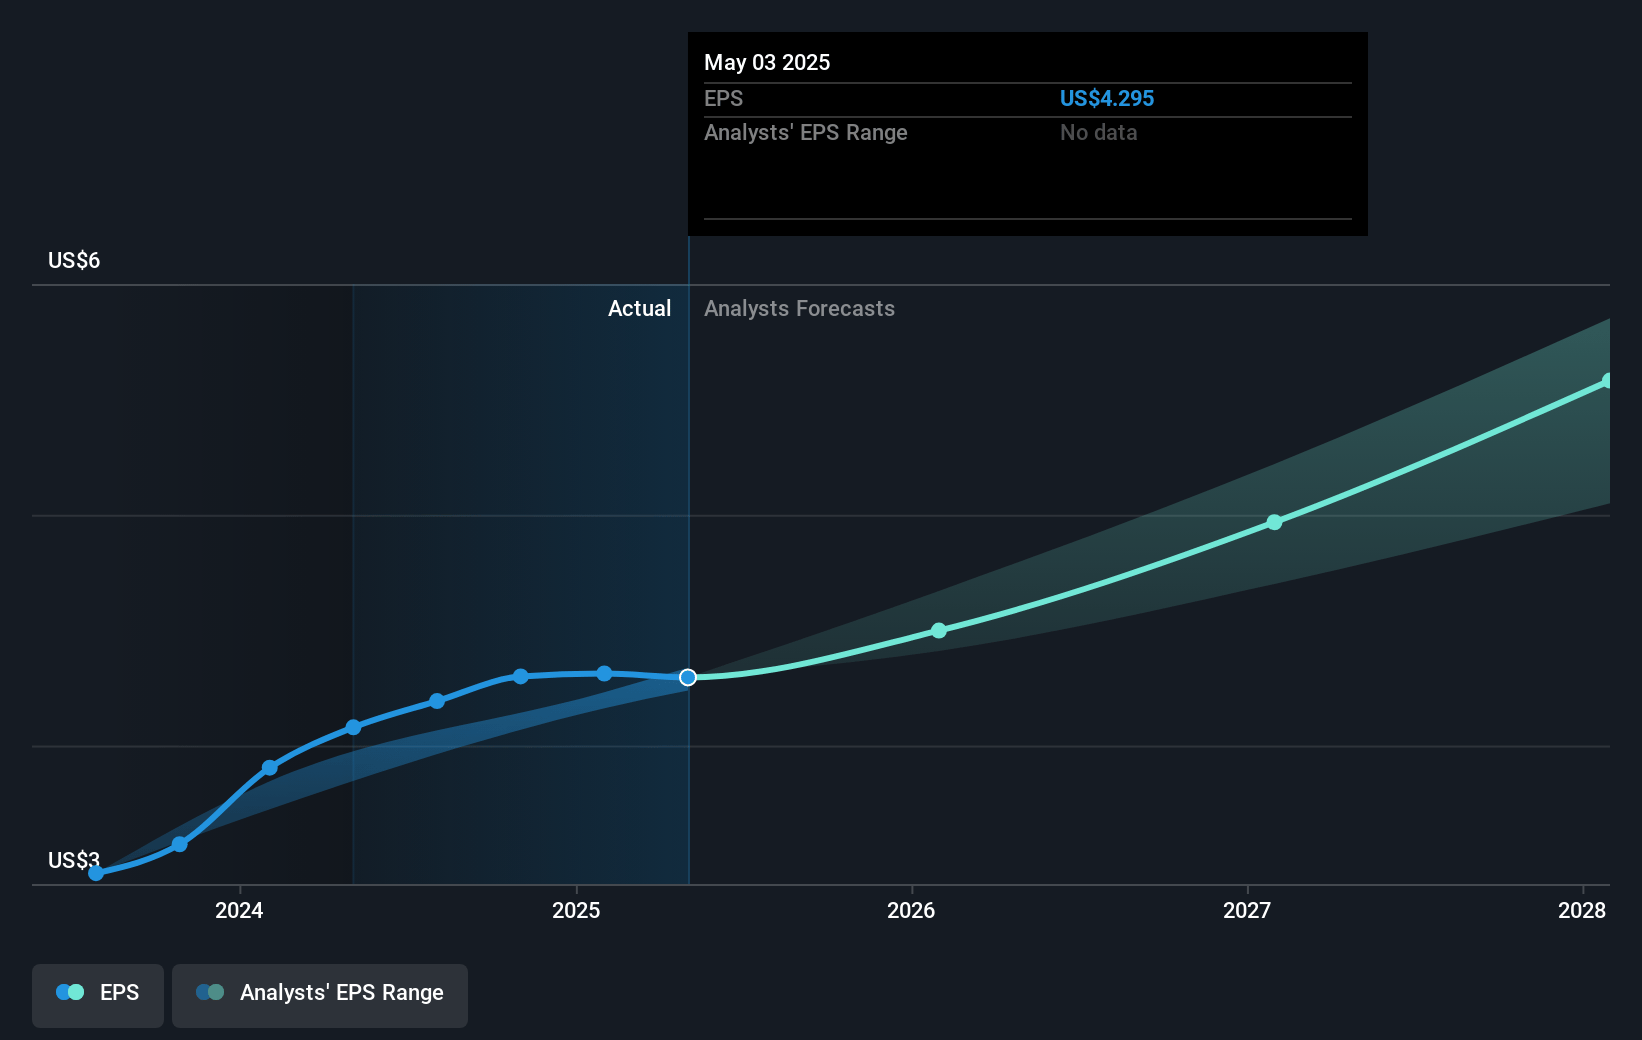
TJX Companies Future Earnings Per Share Growth
Risks
What could happen that would invalidate this narrative?- The unfavorable foreign exchange rates are expected to negatively impact consolidated sales growth and transactional FX, which could reduce revenue and earnings.
- Incremental store wage and payroll costs are causing an increase in SG&A expenses, potentially pressuring net margins.
- The current China tariffs on merchandise may have a small negative impact in the short term, which could influence cost structures and affect earnings.
- The inclusion of e-commerce sales in comp store sales, while expected to have a minimal overall impact, might not significantly boost the typical comp growth, potentially affecting revenue.
- The tightness in U.S. real estate availability and potential rent inflation could increase operating costs, which may squeeze future profit margins.
Valuation
How have all the factors above been brought together to estimate a fair value?- The analysts have a consensus price target of $134.434 for TJX Companies based on their expectations of its future earnings growth, profit margins and other risk factors. However, there is a degree of disagreement amongst analysts, with the most bullish reporting a price target of $154.0, and the most bearish reporting a price target of just $86.0.
- In order for you to agree with the analyst's consensus, you'd need to believe that by 2028, revenues will be $66.3 billion, earnings will come to $6.2 billion, and it would be trading on a PE ratio of 29.3x, assuming you use a discount rate of 7.6%.
- Given the current share price of $128.46, the analyst price target of $134.43 is 4.4% higher. The relatively low difference between the current share price and the analyst consensus price target indicates that they believe on average, the company is fairly priced.
- We always encourage you to reach your own conclusions though. So sense check these analyst numbers against your own assumptions and expectations based on your understanding of the business and what you believe is probable.
How well do narratives help inform your perspective?
Disclaimer
AnalystConsensusTarget is a tool utilizing a Large Language Model (LLM) that ingests data on consensus price targets, forecasted revenue and earnings figures, as well as the transcripts of earnings calls to produce qualitative analysis. The narratives produced by AnalystConsensusTarget are general in nature and are based solely on analyst data and publicly-available material published by the respective companies. These scenarios are not indicative of the company's future performance and are exploratory in nature. Simply Wall St has no position in the company(s) mentioned. Simply Wall St may provide the securities issuer or related entities with website advertising services for a fee, on an arm's length basis. These relationships have no impact on the way we conduct our business, the content we host, or how our content is served to users. The price targets and estimates used are consensus data, and do not constitute a recommendation to buy or sell any stock, and they do not take account of your objectives, or your financial situation. Note that AnalystConsensusTarget's analysis may not factor in the latest price-sensitive company announcements or qualitative material.
Read more narratives


