


Last Update07 May 25Fair value Increased 0.85%
AnalystConsensusTarget has increased revenue growth from -1.7% to -0.6%, increased profit margin from 2.9% to 3.2%, decreased future PE multiple from 11.7x to 10.1x and decreased discount rate from 7.5% to 6.7%.
Read more...Key Takeaways
- Successful refinery turnarounds and focus on operational excellence may improve refining segment costs, boosting net margins and earnings.
- Strategic financial moves and robust segment performances position HF Sinclair for future growth, improved EBITDA, and shareholder benefits.
- Financial instability due to tax credit uncertainties, low sales, and high costs limits HF Sinclair's earnings potential and ability to reinvest in growth.
Catalysts
About HF Sinclair- Operates as an independent energy company in the United States.
- The company's completion of planned turnaround work at key refineries on schedule and budget, along with the focus on commercial and operational excellence, suggests potential future improvements in refining segment operating costs and efficiencies, which could positively impact net margins and earnings.
- The growth in the Marketing segment, with a record quarter in EBITDA and the expansion in branded supplied stores with a significant backlog, indicates opportunities for sustained revenue growth and improved EBITDA in future quarters.
- The continued optimization of the Lubricants and Specialties business towards high-margin specialty products and the successful execution of a turnaround at the Mississauga facility are likely to enhance future revenue and maintain stable earnings given the consistent demand for high-value markets in this segment.
- The Midstream business benefited significantly from increased pipeline revenues, indicating a strong demand and a strategic focus on optimizing the integrated value chain across the company's operations, which points to increased future EBITDA and revenue potential.
- The company's strategic financial moves, including successful refinancing transactions that extended debt maturity profiles and lowered interest expenses, position HF Sinclair well for handling future market fluctuations, ultimately benefiting earnings and shareholder returns through potential increased cash flow and capital management flexibility.
HF Sinclair Future Earnings and Revenue Growth
Assumptions
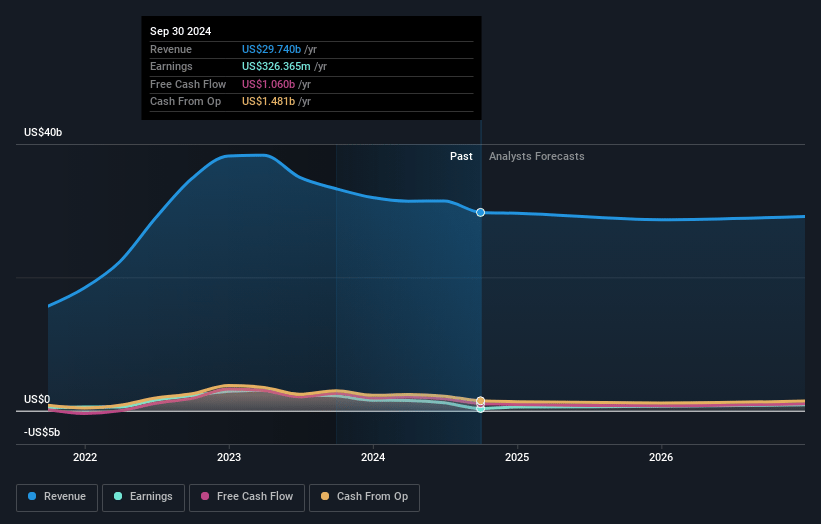
How have these above catalysts been quantified?- Analysts are assuming HF Sinclair's revenue will decrease by 0.6% annually over the next 3 years.
- Analysts assume that profit margins will increase from -0.5% today to 3.2% in 3 years time.
- Analysts expect earnings to reach $880.4 million (and earnings per share of $4.97) by about May 2028, up from $-143.0 million today. However, there is a considerable amount of disagreement amongst the analysts with the most bullish expecting $1.1 billion in earnings, and the most bearish expecting $678.4 million.
- In order for the above numbers to justify the analysts price target, the company would need to trade at a PE ratio of 10.1x on those 2028 earnings, up from -43.0x today. This future PE is lower than the current PE for the US Oil and Gas industry at 11.3x.
- Analysts expect the number of shares outstanding to decline by 1.95% per year for the next 3 years.
- To value all of this in today's terms, we will use a discount rate of 6.75%, as per the Simply Wall St company report.
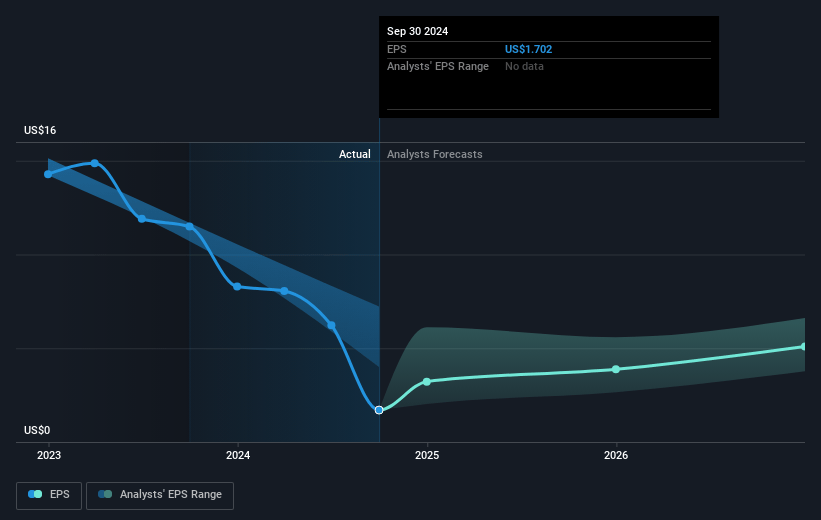
HF Sinclair Future Earnings Per Share Growth
Risks
What could happen that would invalidate this narrative?- The uncertainty and lack of clarity around producers' tax credits are creating financial instability for HF Sinclair, causing potential negative EBITDA impacts; this could lead to challenges in revenue predictability and net margins.
- The company's refining segment is facing reduced margins and sales volumes, significantly impacting adjusted EBITDA compared to previous periods, which may affect overall earnings capacity.
- Increased operating expenses and volatility in the market due to tariffs could undermine financial stability, potentially affecting net margins and operating income.
- The Renewables segment is struggling with low sales volumes and the inability to currently recognize producer's tax credits, thus negatively impacting revenue and earnings.
- High capital expenditures and turnaround costs have contributed to negative cash flow, which might limit HF Sinclair's ability to reinvest in growth or return excess cash to shareholders, affecting future earnings potential.
Valuation
How have all the factors above been brought together to estimate a fair value?- The analysts have a consensus price target of $41.318 for HF Sinclair based on their expectations of its future earnings growth, profit margins and other risk factors. However, there is a degree of disagreement amongst analysts, with the most bullish reporting a price target of $51.0, and the most bearish reporting a price target of just $29.0.
- In order for you to agree with the analyst's consensus, you'd need to believe that by 2028, revenues will be $27.4 billion, earnings will come to $880.4 million, and it would be trading on a PE ratio of 10.1x, assuming you use a discount rate of 6.7%.
- Given the current share price of $32.61, the analyst price target of $41.32 is 21.1% higher.
- We always encourage you to reach your own conclusions though. So sense check these analyst numbers against your own assumptions and expectations based on your understanding of the business and what you believe is probable.
How well do narratives help inform your perspective?
Disclaimer
AnalystConsensusTarget is a tool utilizing a Large Language Model (LLM) that ingests data on consensus price targets, forecasted revenue and earnings figures, as well as the transcripts of earnings calls to produce qualitative analysis. The narratives produced by AnalystConsensusTarget are general in nature and are based solely on analyst data and publicly-available material published by the respective companies. These scenarios are not indicative of the company's future performance and are exploratory in nature. Simply Wall St has no position in the company(s) mentioned. Simply Wall St may provide the securities issuer or related entities with website advertising services for a fee, on an arm's length basis. These relationships have no impact on the way we conduct our business, the content we host, or how our content is served to users. The price targets and estimates used are consensus data, and do not constitute a recommendation to buy or sell any stock, and they do not take account of your objectives, or your financial situation. Note that AnalystConsensusTarget's analysis may not factor in the latest price-sensitive company announcements or qualitative material.
