


Last Update 13 Dec 25
Fair value Increased 0.36%CME: Fee Resilience And New Prediction Markets Will Help Navigate Volatility
Analysts have raised their fair value estimate for CME Group by about $1 to roughly $286 per share, citing the company’s resilient clearing and transaction fee driven revenue base, modestly higher long term growth expectations, and a reinforced competitive moat highlighted in recent target revisions across the Street.
Analyst Commentary
Street research on CME Group reflects a wide range of views on valuation and execution, with recent target changes clustering around expectations for resilient fee income but diverging on the sustainability of growth and the impact of lower volatility.
Bullish Takeaways
- Bullish analysts highlight CME Group's high proportion of revenues from clearing and transaction fees as a key driver of durable, relatively low beta earnings. This is cited as supporting premium valuation multiples.
- The breadth and depth of CME's futures and options complex are viewed as reinforcing a strong competitive moat. This is seen as positioning the company as a primary beneficiary of ongoing macro and credit uncertainty.
- Recent upward price target revisions, including moves into the low to mid $300 range, are interpreted as signaling growing confidence in modestly higher long term growth expectations and continued operating leverage.
- Ongoing innovation around prediction and derivatives related products, including partnerships and adjacent offerings, is seen as a potential incremental growth vector that can extend CME's addressable market over time.
Bearish Takeaways
- Bearish analysts emphasize the sensitivity of volumes to volatility, noting that significantly lower volatility in the recent quarter has pressured trading activity across several asset classes and weighed on near term earnings power.
- Some target cuts into the low $200s underscore concerns that the current valuation embeds optimistic assumptions on sustained volume strength that may prove difficult to meet in a normalized volatility regime.
- Equal Weight and Underweight stances, including from JPMorgan with a target in the mid $200s, reflect caution on upside potential given slower energy trading activity and a more muted outlook for short term catalysts.
- There is also a view that, while CME's moat is strong, growth may decelerate from recent elevated levels. This could limit multiple expansion and leave the shares more vulnerable if macro conditions stabilize and hedging demand recedes.
What's in the News
- CME Group received SEC approval to register CME Securities Clearing Inc, a new securities clearing house designed to support compliance with upcoming U.S. Treasury and repo clearing mandates, with launch targeted for the second quarter of 2026 (company announcement).
- The company and FanDuel unveiled the FanDuel Predicts app, a standalone U.S. platform for trading event contracts tied to major sports, equity indices, commodities, cryptocurrencies, and key economic indicators, expanding CME's reach into retail oriented prediction markets (company announcement).
- CME Group announced plans to launch two non tradable bitcoin volatility indices, BVX and BVXS. These will provide real time and settlement measures of 30 day implied bitcoin volatility derived from activity in its regulated bitcoin options complex (company announcement).
- The firm opened a new office in Dubai's DIFC under a DFSA license. This marks a formal expansion into the Middle East and supports regional FX and derivatives demand, including the listing of the USD/AED currency pair on EBS platforms (company announcement).
- CME Group intends to debut financial contracts tied to sports games and economic indicators by year end. This positions the firm to compete more directly with prediction market platforms such as Kalshi and Polymarket (Bloomberg).
Valuation Changes
- The fair value estimate has risen slightly, increasing from approximately $285.12 per share to about $286.13 per share.
- The discount rate has edged higher, moving from roughly 8.18 percent to about 8.20 percent, implying a marginally higher required return.
- The revenue growth assumption has risen slightly, from around 4.52 percent to approximately 4.54 percent annually.
- The net profit margin expectation has nudged down fractionally, slipping from about 54.80 percent to roughly 54.77 percent.
- The future P/E multiple has increased modestly, from about 32.61x forward earnings to approximately 32.75x.
Key Takeaways
- Strong global demand for risk management, retail engagement, and international expansion drives volume and revenue growth, diversifying CME's client base.
- Innovation in products, technology, and partnerships enhances efficiency and margins, positioning CME for sustainable long-term earnings growth.
- Competitive threats from DeFi, regulatory shifts, and low volatility could erode CME Group's market share, trading volumes, and profit margins over time.
Catalysts
About CME Group- Operates contract markets for the trading of futures and options on futures contracts worldwide.
- Heightened global macroeconomic uncertainty, record sovereign debt issuance, persistent geopolitical tensions, and ongoing trade disputes are fueling sustained demand for risk management and hedging solutions, evidenced by record contract volumes and open interest; this trend is likely to support continued revenue and fee growth.
- Robust international expansion-with record-breaking double-digit ADV growth across EMEA and APAC and rising participation from both institutional and retail clients globally-broadens CME's addressable market and underpins future volume and revenue growth.
- The rapid acceleration of retail engagement, highlighted by a 56% increase in new retail traders and five consecutive quarters of double-digit retail client acquisition growth, diversifies CME's client base and supports both volume and transaction-based revenue growth.
- New product innovations (e.g., Micro contracts, expansion into crypto, FX Spot+), ongoing tech-driven operating efficiencies (cloud migration and tokenization initiatives), and strengthening of strategic partnerships (such as the long-term NASDAQ index license extension and Google Cloud collaboration) are enhancing operating leverage and EBITDA/net margin performance.
- The ongoing global shift toward electronic trading, greater regulatory demands for transparency and standardized clearing, and a proven ability to grow non-transactional revenue (e.g., record market data revenue) position CME to capture a larger share of trading activity and support durable long-term earnings growth.
CME Group Future Earnings and Revenue Growth
Assumptions
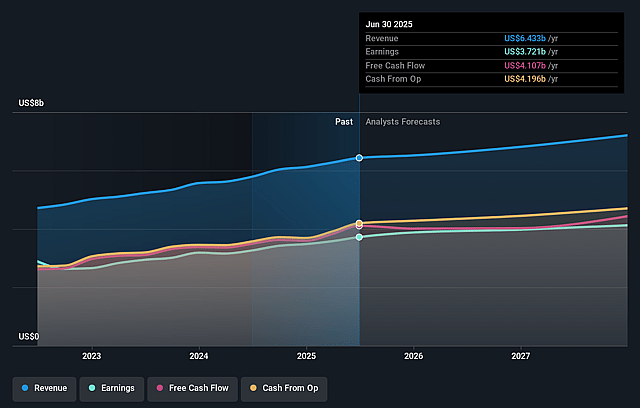
How have these above catalysts been quantified?- Analysts are assuming CME Group's revenue will grow by 4.4% annually over the next 3 years.
- Analysts assume that profit margins will increase from 57.9% today to 58.5% in 3 years time.
- Analysts expect earnings to reach $4.3 billion (and earnings per share of $12.05) by about September 2028, up from $3.7 billion today. The analysts are largely in agreement about this estimate.
- In order for the above numbers to justify the analysts price target, the company would need to trade at a PE ratio of 30.0x on those 2028 earnings, up from 25.3x today. This future PE is greater than the current PE for the US Capital Markets industry at 26.7x.
- Analysts expect the number of shares outstanding to remain consistent over the next 3 years.
- To value all of this in today's terms, we will use a discount rate of 8.13%, as per the Simply Wall St company report.
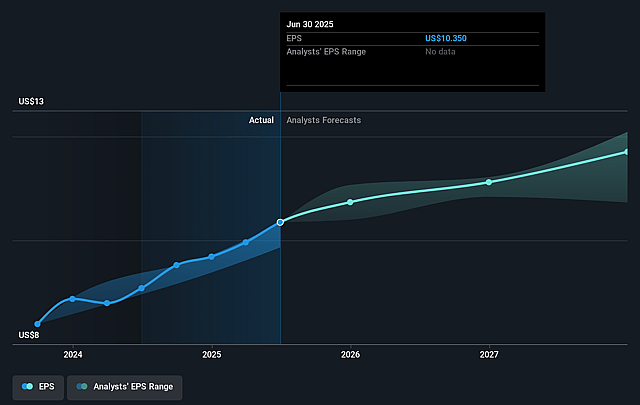
CME Group Future Earnings Per Share Growth
Risks
What could happen that would invalidate this narrative?- Prolonged periods of geopolitical stability and reduced headline risk could curb market volatility, lowering overall demand for risk-hedging and derivatives trading, which may lead to declining trading volumes and negatively impact CME Group's revenue and earnings growth.
- The accelerating adoption of decentralized finance (DeFi) and tokenization technologies poses a long-term competitive threat, as new market structures could enable trading and settlement of derivatives outside of centralized venues like CME, potentially reducing future market share and fee revenues.
- CME's continued heavy reliance on trading activity in interest rate and equity futures exposes the company to periods of subdued volatility or volume in those sectors, which could result in revenue stagnation or contraction and put pressure on net margins.
- Regulatory changes-such as potential increased oversight of retail derivatives trading, limitations on certain products (e.g., perpetuals in the U.S.), or global moves to further tighten derivatives market participation-may dampen speculative activity and reduce overall transaction fees and open interest.
- Intensifying industry competition from alternative electronic trading venues, lower-fee platforms, and the proliferation of OTC derivatives and algorithmic solutions could create sustained pricing pressure, eroding net margins and constraining CME's long-term earnings growth.
Valuation
How have all the factors above been brought together to estimate a fair value?- The analysts have a consensus price target of $282.111 for CME Group based on their expectations of its future earnings growth, profit margins and other risk factors. However, there is a degree of disagreement amongst analysts, with the most bullish reporting a price target of $313.0, and the most bearish reporting a price target of just $212.0.
- In order for you to agree with the analyst's consensus, you'd need to believe that by 2028, revenues will be $7.3 billion, earnings will come to $4.3 billion, and it would be trading on a PE ratio of 30.0x, assuming you use a discount rate of 8.1%.
- Given the current share price of $261.53, the analyst price target of $282.11 is 7.3% higher. The relatively low difference between the current share price and the analyst consensus price target indicates that they believe on average, the company is fairly priced.
- We always encourage you to reach your own conclusions though. So sense check these analyst numbers against your own assumptions and expectations based on your understanding of the business and what you believe is probable.
Have other thoughts on CME Group?
Create your own narrative on this stock, and estimate its Fair Value using our Valuator tool.
Create NarrativeHow well do narratives help inform your perspective?
Disclaimer
AnalystConsensusTarget is a tool utilizing a Large Language Model (LLM) that ingests data on consensus price targets, forecasted revenue and earnings figures, as well as the transcripts of earnings calls to produce qualitative analysis. The narratives produced by AnalystConsensusTarget are general in nature and are based solely on analyst data and publicly-available material published by the respective companies. These scenarios are not indicative of the company's future performance and are exploratory in nature. Simply Wall St has no position in the company(s) mentioned. Simply Wall St may provide the securities issuer or related entities with website advertising services for a fee, on an arm's length basis. These relationships have no impact on the way we conduct our business, the content we host, or how our content is served to users. The price targets and estimates used are consensus data, and do not constitute a recommendation to buy or sell any stock, and they do not take account of your objectives, or your financial situation. Note that AnalystConsensusTarget's analysis may not factor in the latest price-sensitive company announcements or qualitative material.