Key Takeaways
- Expansion and development projects are expected to drive revenue growth and improve profitability by increasing capacity and portfolio offerings.
- Favorable demographic trends and potential beneficial legislation are anticipated to support long-term revenue growth and reduce operating costs.
- Cannibalization, declining margins, high capital expenditure, and leveraged financial position challenge Red Rock Resorts' revenue and profitability amidst competitive and economic pressures.
Catalysts
About Red Rock Resorts- Through its interest in Station Casinos LLC, develops and operates casino and entertainment properties in the United States.
- The expansion of the Durango property, including additional casino space and amenities, is expected to drive future revenue growth by attracting more customers and increasing the property's capacity. This expansion aims to improve the earnings and contribute to high-margin revenue operations.
- The development pipeline, including projects like North Fork and Las Vegas Valley properties (such as Cactus and Inspirada), provides significant growth opportunities. These projects are anticipated to expand the portfolio, contributing to increased revenue and long-term profitability.
- Strategic investments in existing properties to refresh and add new amenities, such as the renovations at Sunset Station and Green Valley Ranch, are likely to maintain or enhance net margins by increasing customer engagement and spending levels.
- The favorable demographic growth trends in the Las Vegas Valley, including the increase of households in areas like Summerlin and Cadence, are expected to offset any revenue cannibalization and support consistent long-term revenue growth.
- Potential upcoming legislation, such as tax changes beneficial to businesses in the region, could enhance net margins and reduce operating expenses, supporting overall earnings growth in the future.
Red Rock Resorts Future Earnings and Revenue Growth
Assumptions
How have these above catalysts been quantified?- Analysts are assuming Red Rock Resorts's revenue will grow by 2.2% annually over the next 3 years.
- Analysts assume that profit margins will increase from 8.6% today to 10.9% in 3 years time.
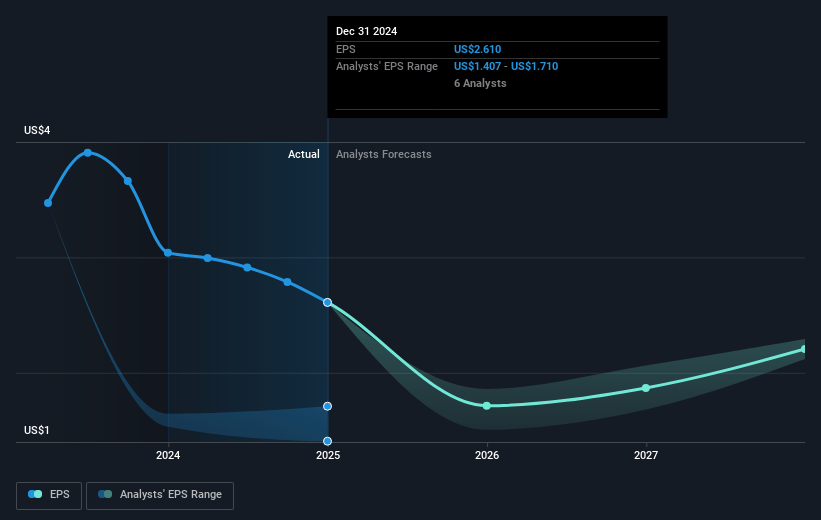
- Analysts expect earnings to reach $222.3 million (and earnings per share of $1.74) by about January 2028, up from $163.8 million today. However, there is some disagreement amongst the analysts with the more bearish ones expecting earnings as low as $183.8 million.
- In order for the above numbers to justify the analysts price target, the company would need to trade at a PE ratio of 41.7x on those 2028 earnings, up from 17.4x today. This future PE is greater than the current PE for the US Hospitality industry at 24.3x.
- Analysts expect the number of shares outstanding to grow by 6.81% per year for the next 3 years.
- To value all of this in today's terms, we will use a discount rate of 9.09%, as per the Simply Wall St company report.
Red Rock Resorts Future Earnings Per Share Growth
Risks
What could happen that would invalidate this narrative?- The company is facing cannibalization from the Durango property, which has impacted revenue at the Red Rock location and could continue to affect overall revenue performance if not offset by growth in other areas.
- The company's adjusted EBITDA margin decreased by 333 basis points year-over-year, indicating potential pressure on profitability despite revenue growth, which could affect net margins and earnings.
- While expansions and renovations are planned, they involve high capital expenditure and could lead to disruption during construction, potentially impacting short-term revenues and cash flow.
- The company's net debt stands at $3.35 billion with a net debt-to-EBITDA ratio of 4.2x, suggesting financial leverage that could strain financial flexibility and impact earnings if economic conditions worsen.
- Group sales and catering businesses face tough comparables, and reported softness may continue, potentially affecting the growth of non-gaming segments, which are critical for diversifying revenue streams.
Valuation
How have all the factors above been brought together to estimate a fair value?- The analysts have a consensus price target of $55.79 for Red Rock Resorts based on their expectations of its future earnings growth, profit margins and other risk factors. However, there is a degree of disagreement amongst analysts, with the most bullish reporting a price target of $66.0, and the most bearish reporting a price target of just $44.0.
- In order for you to agree with the analyst's consensus, you'd need to believe that by 2028, revenues will be $2.0 billion, earnings will come to $222.3 million, and it would be trading on a PE ratio of 41.7x, assuming you use a discount rate of 9.1%.
- Given the current share price of $48.34, the analyst's price target of $55.79 is 13.3% higher.
- We always encourage you to reach your own conclusions though. So sense check these analyst numbers against your own assumptions and expectations based on your understanding of the business and what you believe is probable.
How well do narratives help inform your perspective?
Disclaimer
Warren A.I. is a tool utilizing a Large Language Model (LLM) that ingests data on consensus price targets, forecasted revenue and earnings figures, as well as the transcripts of earnings calls to produce qualitative analysis. The narratives produced by Warren A.I. are general in nature and are based solely on analyst data and publicly-available material published by the respective companies. These scenarios are not indicative of the company's future performance and are exploratory in nature. Simply Wall St has no position in the company(s) mentioned. The price targets and estimates used are consensus data, and do not constitute a recommendation to buy or sell any stock, and they do not take account of your objectives, or your financial situation. Note that Warren A.I.'s analysis may not factor in the latest price-sensitive company announcements or qualitative material.
Read more narratives
There are no other narratives for this company.
View all narratives


