

Key Takeaways
- Strategic product innovation and enhanced menu offerings aim to boost revenue growth through increased customer engagement and sales.
- International expansion and cost efficiencies in restaurant operations are expected to drive revenue growth and improve net margins.
- Declines in sales and increased costs from strategic investments and marketing pressure margins, potentially hindering profit and cash flow growth.
Catalysts
About Papa John's International- Operates and franchises pizza delivery and carryout restaurants under the Papa Johns trademark in the United States, Canada, and internationally.
- Papa John's strategic focus on product innovation and enhancing the menu with new offerings is expected to boost revenue growth by increasing customer engagement and driving higher ticket sales.
- The investment of up to $25 million in marketing, including CRM capabilities and the Papa Rewards loyalty program, aims to drive greater customer loyalty and frequency, which should positively impact revenue.
- Efforts to reduce restaurant build costs and refranchise company-owned locations to growth-oriented franchisees are expected to improve net margins by enhancing operational efficiency and scale.
- The international expansion with emphasis on key growth markets, such as the Middle East and Latin America, aims to generate higher average unit volumes, contributing to revenue growth and increased earnings.
- The review of the North American commissary and distribution network to improve supply chain efficiency is likely to enhance franchisee profitability and support net margins through cost savings.
Papa John's International Future Earnings and Revenue Growth
Assumptions
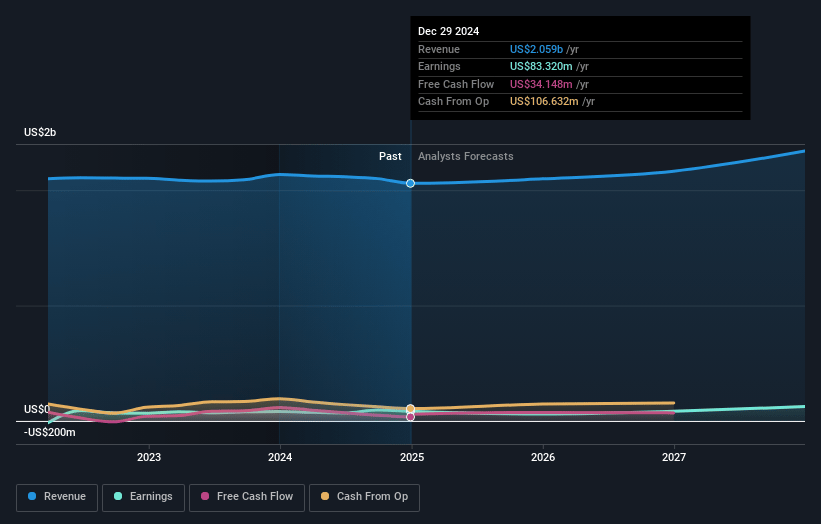
How have these above catalysts been quantified?- Analysts are assuming Papa John's International's revenue will grow by 4.3% annually over the next 3 years.
- Analysts assume that profit margins will increase from 4.0% today to 5.3% in 3 years time.
- Analysts expect earnings to reach $123.8 million (and earnings per share of $3.85) by about March 2028, up from $83.3 million today.
- In order for the above numbers to justify the analysts price target, the company would need to trade at a PE ratio of 18.4x on those 2028 earnings, up from 18.2x today. This future PE is lower than the current PE for the US Hospitality industry at 23.3x.
- Analysts expect the number of shares outstanding to decline by 0.94% per year for the next 3 years.
- To value all of this in today's terms, we will use a discount rate of 9.33%, as per the Simply Wall St company report.
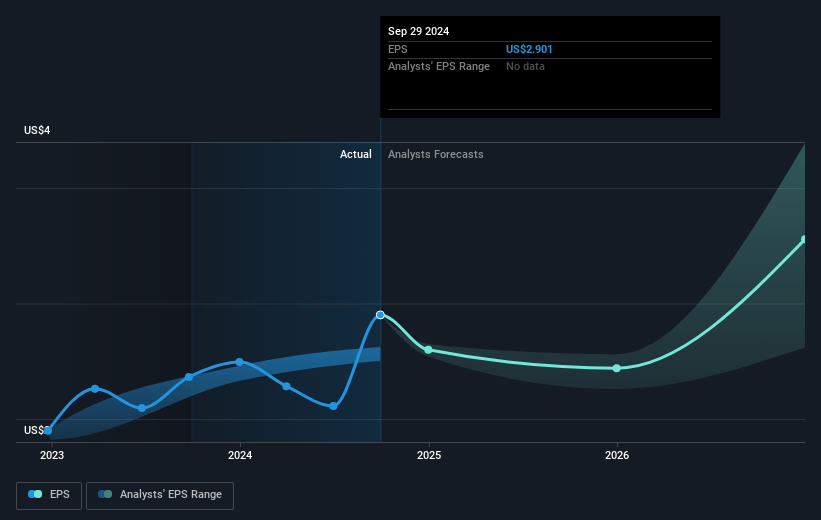
Papa John's International Future Earnings Per Share Growth
Risks
What could happen that would invalidate this narrative?- The global system-wide restaurant sales declined by approximately 8% due to the additional week of operations in the prior year, indicating a lack of growth in actual sales, which can affect revenue and earnings.
- North America comparable sales were down 4% in the fourth quarter, impacted by strategic pricing decisions and a focus on value offerings, potentially affecting net margins negatively due to increased pressure on tickets.
- International comparable sales were cautiously projected to be flat to up 2% due to a dynamic operating environment, indicating potential risks in achieving meaningful growth, impacting overall revenue and earnings.
- The guidance for adjusted EBITDA projects a decrease from $227 million in 2024 to between $200 million and $220 million in 2025, due to continued strategic investments, which could strain profit margins and earnings.
- An increased marketing spend of up to $25 million and high commodity prices are expected to pressure operating margins, and if not offset by revenue growth, they could negatively impact net margins and cash flows.
Valuation
How have all the factors above been brought together to estimate a fair value?- The analysts have a consensus price target of $56.308 for Papa John's International based on their expectations of its future earnings growth, profit margins and other risk factors. However, there is a degree of disagreement amongst analysts, with the most bullish reporting a price target of $66.0, and the most bearish reporting a price target of just $45.0.
- In order for you to agree with the analyst's consensus, you'd need to believe that by 2028, revenues will be $2.3 billion, earnings will come to $123.8 million, and it would be trading on a PE ratio of 18.4x, assuming you use a discount rate of 9.3%.
- Given the current share price of $46.52, the analyst price target of $56.31 is 17.4% higher.
- We always encourage you to reach your own conclusions though. So sense check these analyst numbers against your own assumptions and expectations based on your understanding of the business and what you believe is probable.
How well do narratives help inform your perspective?
Disclaimer
Warren A.I. is a tool utilizing a Large Language Model (LLM) that ingests data on consensus price targets, forecasted revenue and earnings figures, as well as the transcripts of earnings calls to produce qualitative analysis. The narratives produced by Warren A.I. are general in nature and are based solely on analyst data and publicly-available material published by the respective companies. These scenarios are not indicative of the company's future performance and are exploratory in nature. Simply Wall St has no position in the company(s) mentioned. Simply Wall St may provide the securities issuer or related entities with website advertising services for a fee, on an arm's length basis. These relationships have no impact on the way we conduct our business, the content we host, or how our content is served to users. The price targets and estimates used are consensus data, and do not constitute a recommendation to buy or sell any stock, and they do not take account of your objectives, or your financial situation. Note that Warren A.I.'s analysis may not factor in the latest price-sensitive company announcements or qualitative material.