

Key Takeaways
- Strategic focus on high-growth areas like data centers and subsidiary consolidation aims to boost revenue and improve net margins through increased efficiency.
- Cost reduction and strong cash flow facilitate strategic acquisitions, enhancing revenue growth and earnings, while policy changes could further drive residential market activity.
- Economic challenges and market conditions are constraining demand and sales, with uncertainty impacting revenue growth and financial performance across several sectors.
Catalysts
About GMS- Distributes wallboard, ceilings, steel framing and complementary construction products in the United States and Canada.
- GMS is strategically focusing on expanding its product offerings in areas with high potential growth such as data centers. This sector is expected to grow over 10% through 2026, providing an opportunity to increase revenue and maintain higher gross margins due to the demand for higher-end products.
- The company is undergoing a subsidiary consolidation program aimed at driving efficiencies. This program is expected to ultimately lead to better inventory management and enhanced pricing and purchasing practices, potentially improving net margins over the long term as these efficiencies take hold.
- GMS's ongoing cost reduction efforts, including a new $20 million annualized cost reduction plan, are expected to further improve profitability. They are anticipated to significantly enhance earnings by aligning operational costs with the current demand levels, primarily impacting net margins and EBITDA.
- There is a potential catalyst from governmental and policy changes, particularly in Canada where pro-development policies have led to significant increases in residential building permits. Similar policies in the U.S. could stimulate residential activity, bolstering future revenue levels as well as benefiting net margins through increased sales volumes.
- GMS is generating significant cash flow and maintaining a strong balance sheet, allowing them the flexibility to pursue strategic acquisitions in margin-accretive categories like EIFS and stucco, tools, and fasteners. This strategic capital allocation is expected to boost revenue growth and improve overall earnings when market conditions improve.
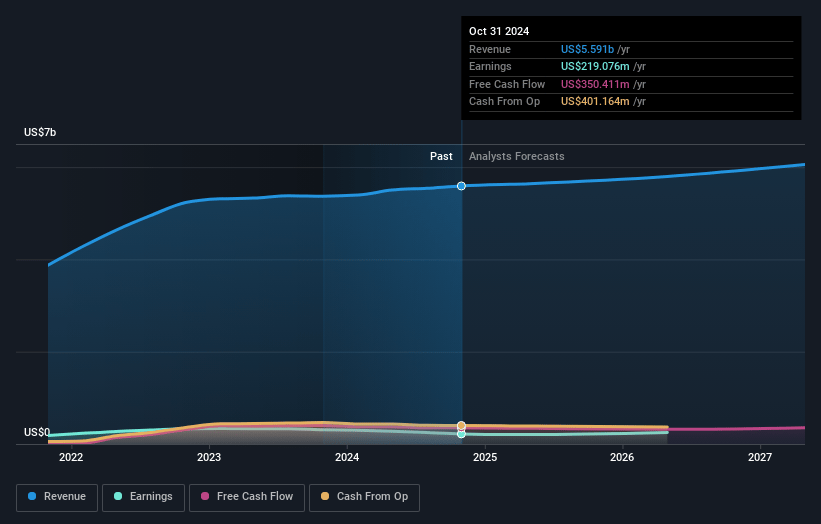
GMS Future Earnings and Revenue Growth
Assumptions
How have these above catalysts been quantified?- Analysts are assuming GMS's revenue will grow by 1.2% annually over the next 3 years.
- Analysts assume that profit margins will increase from 2.6% today to 3.7% in 3 years time.
- Analysts expect earnings to reach $212.0 million (and earnings per share of $5.82) by about March 2028, up from $145.8 million today.
- In order for the above numbers to justify the analysts price target, the company would need to trade at a PE ratio of 17.2x on those 2028 earnings, down from 19.0x today. This future PE is lower than the current PE for the US Trade Distributors industry at 19.0x.
- Analysts expect the number of shares outstanding to decline by 3.18% per year for the next 3 years.
- To value all of this in today's terms, we will use a discount rate of 8.67%, as per the Simply Wall St company report.
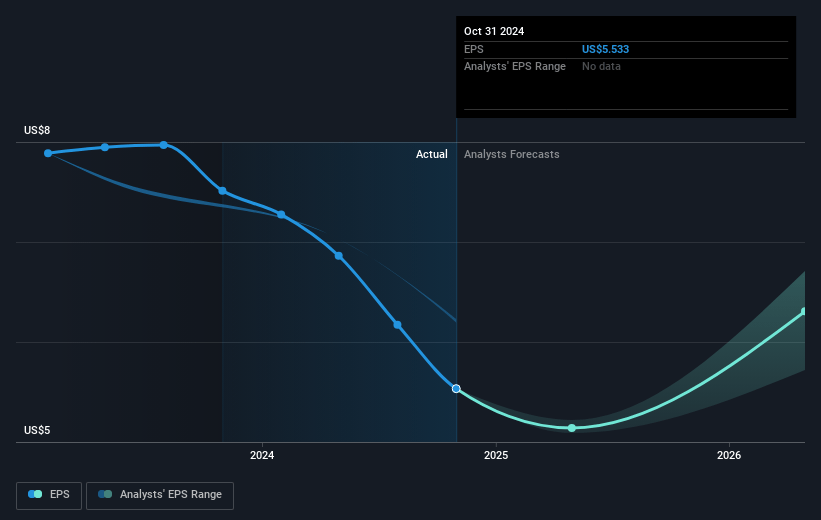
GMS Future Earnings Per Share Growth
Risks
What could happen that would invalidate this narrative?- Challenging macro environment and deteriorating demand conditions have led to reduced sales volumes and gross margins, impacting current and potentially future revenue growth.
- Tight lending conditions and economic uncertainty are causing project delays and slower activity in end markets, affecting net sales and earnings.
- The office and commercial markets continue to suffer, with a large drop in office space construction, impacting future revenue potential in those sectors.
- High mortgage rates and economic uncertainty continue to suppress demand in the single-family housing market, negatively affecting sales and revenue potential.
- Continued broad economic uncertainty, including the impact of potential tariffs and policy decisions, creates a risk of further pressures on margins and overall financial performance.
Valuation
How have all the factors above been brought together to estimate a fair value?- The analysts have a consensus price target of $83.333 for GMS based on their expectations of its future earnings growth, profit margins and other risk factors. However, there is a degree of disagreement amongst analysts, with the most bullish reporting a price target of $111.0, and the most bearish reporting a price target of just $65.0.
- In order for you to agree with the analyst's consensus, you'd need to believe that by 2028, revenues will be $5.8 billion, earnings will come to $212.0 million, and it would be trading on a PE ratio of 17.2x, assuming you use a discount rate of 8.7%.
- Given the current share price of $72.07, the analyst price target of $83.33 is 13.5% higher.
- We always encourage you to reach your own conclusions though. So sense check these analyst numbers against your own assumptions and expectations based on your understanding of the business and what you believe is probable.
How well do narratives help inform your perspective?
Disclaimer
Warren A.I. is a tool utilizing a Large Language Model (LLM) that ingests data on consensus price targets, forecasted revenue and earnings figures, as well as the transcripts of earnings calls to produce qualitative analysis. The narratives produced by Warren A.I. are general in nature and are based solely on analyst data and publicly-available material published by the respective companies. These scenarios are not indicative of the company's future performance and are exploratory in nature. Simply Wall St has no position in the company(s) mentioned. Simply Wall St may provide the securities issuer or related entities with website advertising services for a fee, on an arm's length basis. These relationships have no impact on the way we conduct our business, the content we host, or how our content is served to users. The price targets and estimates used are consensus data, and do not constitute a recommendation to buy or sell any stock, and they do not take account of your objectives, or your financial situation. Note that Warren A.I.'s analysis may not factor in the latest price-sensitive company announcements or qualitative material.