Narratives are currently in beta
Key Takeaways
- Expansion of DTA sales beyond Europe and introduction of new products are expected to drive significant revenue growth.
- Initiatives like PEP and strategic sourcing aim to enhance operational efficiency and improve profit margins.
- Sluggish industrial trends and reliance on lower-margin services threaten Enerpac's revenue growth and net margins amid macroeconomic pressures in key markets.
Catalysts
About Enerpac Tool Group- Manufactures and sells a range of industrial products and solutions in the United States, the United Kingdom, Germany, Australia, Canada, China, Saudi Arabia, Brazil, France, and internationally.
- Expansion of DTA sales beyond Europe using Enerpac's global commercial network is expected to drive revenue growth, particularly by leveraging the acquisition's capabilities in Heavy Lifting Technology.
- The implementation of the Powering Enerpac Performance (PEP) continuous improvement program is anticipated to enhance operational efficiency and productivity, potentially improving net margins.
- Optimizing the supply chain through strategic sourcing initiatives and supply base reductions could improve gross profit margins by leveraging buying power and achieving better cost control.
- The introduction of new products, such as Battery Torque Wrenches and hydraulic pullers, shows potential for increased revenue by addressing specific customer demands across various markets.
- Investment in commercial tools like Enerpac Commercial Excellence (ECX) and the expansion of second branding strategy in Asia Pacific are expected to support revenue growth and enhance market position.
Enerpac Tool Group Future Earnings and Revenue Growth
Assumptions
How have these above catalysts been quantified?- Analysts are assuming Enerpac Tool Group's revenue will grow by 7.2% annually over the next 3 years.
- Analysts assume that profit margins will increase from 14.4% today to 18.3% in 3 years time.
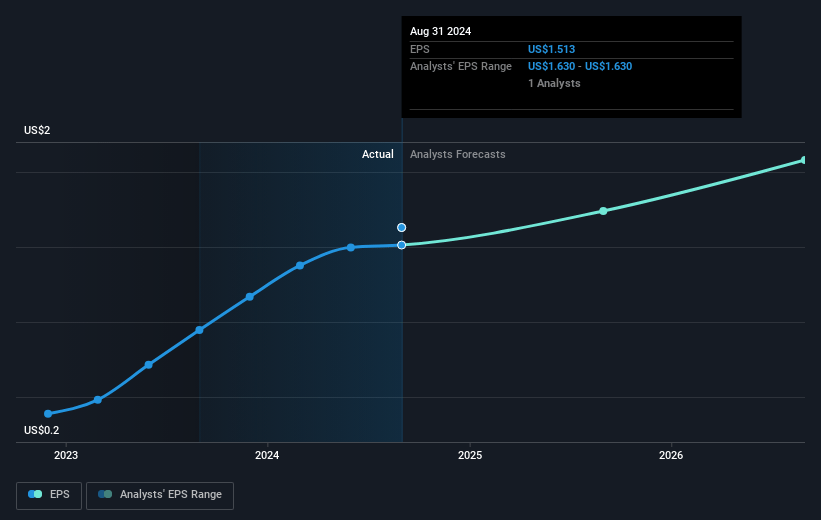
- Analysts expect earnings to reach $133.3 million (and earnings per share of $2.41) by about January 2028, up from $85.6 million today. The analysts are largely in agreement about this estimate.
- In order for the above numbers to justify the analysts price target, the company would need to trade at a PE ratio of 29.8x on those 2028 earnings, up from 28.6x today. This future PE is greater than the current PE for the US Machinery industry at 24.0x.
- Analysts expect the number of shares outstanding to grow by 0.54% per year for the next 3 years.
- To value all of this in today's terms, we will use a discount rate of 6.96%, as per the Simply Wall St company report.
Enerpac Tool Group Future Earnings Per Share Growth
Risks
What could happen that would invalidate this narrative?- The industrial macro environment remains sluggish, with weak manufacturing PMI and industrial production trends, which could result in lower revenue growth for Enerpac Tool Group.
- The company experienced a decline in organic sales despite overall revenue increase, highlighting dependence on service revenue growth, which could pressure net margins if product sales don’t recover.
- Gross profit margin declined by 90 basis points due to a mix of lower sales in key regions like the Americas and a higher percentage of lower-margin service revenue, negatively impacting earnings potential.
- Continued macroeconomic pressures in significant markets, such as EMEA (Germany and France) and the Americas, could constrain revenue growth if market conditions do not improve.
- The services business, which has performed well in terms of growth, remains a margin diluter due to the labor-intensive nature of certain services offered, potentially impacting overall profitability and net margins negatively.
Valuation
How have all the factors above been brought together to estimate a fair value?- The analysts have a consensus price target of $59.0 for Enerpac Tool Group based on their expectations of its future earnings growth, profit margins and other risk factors.
- In order for you to agree with the analyst's consensus, you'd need to believe that by 2028, revenues will be $729.3 million, earnings will come to $133.3 million, and it would be trading on a PE ratio of 29.8x, assuming you use a discount rate of 7.0%.
- Given the current share price of $45.01, the analyst's price target of $59.0 is 23.7% higher.
- We always encourage you to reach your own conclusions though. So sense check these analyst numbers against your own assumptions and expectations based on your understanding of the business and what you believe is probable.
How well do narratives help inform your perspective?
Disclaimer
Warren A.I. is a tool utilizing a Large Language Model (LLM) that ingests data on consensus price targets, forecasted revenue and earnings figures, as well as the transcripts of earnings calls to produce qualitative analysis. The narratives produced by Warren A.I. are general in nature and are based solely on analyst data and publicly-available material published by the respective companies. These scenarios are not indicative of the company's future performance and are exploratory in nature. Simply Wall St has no position in the company(s) mentioned. The price targets and estimates used are consensus data, and do not constitute a recommendation to buy or sell any stock, and they do not take account of your objectives, or your financial situation. Note that Warren A.I.'s analysis may not factor in the latest price-sensitive company announcements or qualitative material.
Read more narratives
There are no other narratives for this company.
View all narratives


